Showing posts with label scientists. Show all posts

2015-11-16

How do we know that the Earth has a core?


1. A typical depiction of the core
of the Earth.

Many of us have wondered, at some point of our lives, why the cartoons depicting the Earth as a watermelon with a missing portion always show this ball in the center named the 'core'. How do we know that a distinct 'body' is actually down there, 2900 km below the surface?

Let's see: we know the total mass of the Earth through its gravitational interaction with the solar system. In 1797, Cavendish [ref.1] measured the Gravitational constant G and the density of the Earth is ever since known to be about 5.51 times the density of water: nearly twice the average rock density we find at the surface.

In 1898, Wiechert suggested [ref.2] that this high Earth’s density could be explained by a core in the center made of nickel and iron (like many meteorites known at the time) surrounded by a shell, or mantle, of the lighter silicon-dominated rocks that we see in the surface.

2. Inge Lehmann was one of the key
discoverers of the inner core of the Earth.
But only in 1906, Richard D. Oldham found that the increasing speed of seismic waves with depth within the Earth holds only down to 2890 km below the surface. Deeper than that, the mechanical (acoustic) waves propagate much slower (fig. 6), suggesting a different rock nature. Because this distinct material did not transmit shear seismic waves, it became clear that this core is liquid.

But in 1936, Inge Lehmann (picture on the right) found that the center of the core is indeed nearly-solid, since she inferred weak shear waves travelling through it [ref. 4] using highly-sensitive seismometers in New Zealand. This has become known as the inner core.


3. Images of the tsunami following last week's earthquake in Chile.

Today, detecting the core down there has become a doable task for anyone. Last week's earthquake in Chile, for example, provides a great opportunity for you to check if Oldham did everything right. You only need to get seismograms from seismic stations around the world (many of these stations have their data available online, real time), and sort the signals according to the distance from the station to the EQ's epicenter, using the same time of reference, like in this image:
4. Left: Each horizontal line is a seismogram of the Chile earthquake recorded at different locations of the planet (check USGS: 2015-10-16; Mw=8.3). Each seismogram is plotted according to the distance of the measuring station to the earthquake (vertical axis). The red circle shows the signal gap due to the outer core.
Right: Same image, with the identification of the arrivals of the different seismic waves. 'P' waves are the compressional waves, they are first to arrive all around the planet's surface.
The horizontal axis shows elapsed time, measured since the EQ occurred.
The vertical axis shows the distance from the measuring station to the EQ.
The red circle shows the region (around 110 degrees from the source) where the first seismic waves are not recorded. 

5. Seismic shadow produced by an imaginary
earthquake occurring at the north pole. The
outer core, due to its slower seismic velocity,
refracts the mechanical waves of the earthquake,
shadowing a vast region of the planet, as seen
in figure 4.
6. The velocity of seismic waves
changes with depth within the Earth.


In summary: the absence of wave reception in regions around 14,000 km (between 103 and 143 degrees) apart from the hypocenter demonstrates that there is a liquid core where seismic waves travel slow.
Isn't it amazing that nobody realized this before the 20th century?

Finally, remember that the outer core is where the magnetic field of the Earth is generated, by the thermal convection of conductive molten iron around a nearly-solid iron inner core. In fact the changes in the convection patterns in the outer core seem responsible for the rapid historical changes observed in the magnetic field. There is more about the magnetic field in this earlier post.

7. Convection in the iron-dominated outer core around
a nearly solid core is widely accepted as the cause for the 
Earth's magnetic field, and known as the geodynamo. 
(Glatzmaier & Roberts).
Update 2015-11: a new study suggests that the core (and thus the magnetic field) was formed by the gradual cooling of the Earth only 1 to 1.5 billion years ago.

Update 2015-12: Geophysicists call it the new core paradox: They can't quite explain how the ancient Earth could have sustained a magnetic field billions of years ago, as it was cooling from its fiery birth. Now, two scientists have proposed two different explanations. http://ow.ly/W3eQX

References (thank you nuclearplanet):
1. Cavendish, H., Experiments to determine the density of Earth. Philosophical Transactions of the Royal Society of London, 1798, 88, 469-479.
2. Wiechert, E., Über die Massenverteilung im Inneren der Erde. Nachr. K. Ges. Wiss. Goettingen, Math-Kl., 1897, 221-243.
3. Oldham, R. D., The constitution of the interior of the Earth as revealed by earthquakes. Q. T. Geol. Soc. Lond., 1906. 62, 459-486.
4. Lehmann, I., P'. Publ. Int. Geod. Geophys. Union, Assoc. Seismol., Ser. A, Trav. Sci., 1936, 14, 87-115.

2015-01-14

Scientist evaluation, citations, and the #PaperBubble

[A bit of self-criticism on the science evaluation system, just to start the year.]

Wicked rules can pervert a community.
In science, the pioneer wicked rule was evaluating scientists for how much we published, how many papers we coauthored regardless of our real contribution to them, and in what journals do we publish, as a proxy for quality or merit. If you coauthor many articles in good (very cited) journals then you must be a good scientist, that was the institutional mantra. The basic underlaying assumption was that the citations to someone's work by other scientists are a good measure of the importance of her/his research, and I will not question this here. But in this century, to measure the importance of someone's work, we don't need impact factors anymore and we don't need to care about what journal hosts the article in question, because individual citations to each individual article are accessible in a few clicks.
Evaluating by the “mere number of a researcher’s publications” disincentivized risky and potentially-ground-breaking research lacking a short-term publication outcome, as the editor of Science argues. But this is what was being done. And as a result, the scientific articles published every year have nearly tripled since 1990.
Cumulative number of papers
published in Biomedicine
(source: PubMed via this)

The same has happened in most countries and in most disciplines, although some have moved much faster than the average, look :-)
Annual number of papers in Yoga studies over time.

Does this mean that our science is now three times better? Does it mean that our understanding of Nature grows 3 times faster than 25 years ago? 10 times, in the case of Yoga? Mmm. It does mean that now we can only track a small fraction of all the papers that are relevant to our research. 

[By Zhou Tao/Shanghai Daily] 

Needless to say, this has yet another additional price for all of us:

To compensate for the perversion inherent to this article-count approach, evaluators started weighting that number with something called Journal Impact Factor, assuming that articles published in highly cited journals have a higher, statistically-sound chance to have an impact. Perfect plot for a self-accomplishing prophecy; The warnings against this practice are a clamor.


Then citation databases went online and another wicked parameter came on the scene:
h, the Hirsch index, was adopted in the last decade to come over the number of publications criterion. It has now become a commonplace in the evaluation of proposals. But h keeps overvaluing multi-authored papers beyond reason, because it disregards the number of authors and their relative contribution (in most research areas, the relative scientific contribution of the authors of a paper can be approximated in first approach by the position in the author list). The citations to an article of yours count equally if you are the 1st author or the 100th. Therefore, a paper with 100 authors has 100 times more impact on the evaluation system that a single-authored paper. And I'm not being rhetorical here. Please, meet two of the highest-h scientists in Spain (just an example):
Profile 1: 61k citations, 137 papers in 2013 only, h=112.
Profile 2: 117k citations, 164 papers in 2013 only, h=75.
I leave it to you finding the flaw.

Say you are part of a group of 100 friends, each leading his/her own paper and incorporating the other 99 as coauthors. Each citation to any of those 100 papers will reward 100 more people than citing a lonely author. Imagine now that each of them cites each other's paper. They immediately obtain 100 citations per paper. Not bad. It may seem this is a problem with self-citation that can be filtered easily, but it goes far beyond that. The 100 will still be rewarded beyond reason even if their citations come from someone else. Imagine that another group of 100 authors cites all your 100 papers as well as the lonely author's paper. This will give 100 citations to the single author but 10,000 citations to all others. Note that, if this were the first articles for all of them, then the single author would now be h=1, while all other have been miraculously promoted to h=100. 

This problem could be easily solved by weighting each author by 1/2^i , where i is the position of each author in the list. Because


, the weight of all papers would be equal in the citation system. For this, the remainder of the series must be given to the last author, which in practice implies that the last 2 authors get the same credit. Definitely, much fairer than giving all authors a weight of one.

But this was not done. Seemingly, decision makers were not interested in implementing anything like that.

Very predictably, the number of authors per paper just rocketed, and former research groups have often become author pools, with the entire group signing every paper published by each of its members. A symptom of this is that few researchers dare to publish on their own today:
Average number of authors per paper during the
last 100 years.
Source: PubMed
% of single-authored papers
over the last century. 


Papers published per year. Source

The left bar indicates the average number of
articles published by authors that stopped
publishing 15 years after their first publication.
The blue bar on the right shows the articles
published in the same timespan but by
researchers that continued publishing after 15
years. The red bar on top indicates the articles of
those same researchers after the 15th year. One
can see that the researchers that continue
publishing are those having a high research
output. It also shows that the research output
before the year break is the portion that
contributes most to the overall values. Source


So the drive to scientific publication is still based on quantity, not quality.


Ask any editor how many of their requests to review a manuscript are refused by peers, and you'll learn that they often end up doing the reviews themselves. Too many papers for such few reviewers/authors. It is unsurprising that you find funny bugs like this in articles that were supposed to have been reviewed.


It is difficult to find objective (quantitative) criteria for quality. And perhaps it is also time to question the trust on objective parameters. Alternatives such as interpreting the subjective impact foreseen for a given research are also risky. But if the citation criterion is to be adopted, then we do not need h-like indexes or journal impact factors. There are better metrics proposed (examples), they just need to be adopted. Metrics accounting for the author order and the number of coauthors.

Under the present rules, young researchers are pressed to publish as much as possible instead of publishing as good as possible, not only perverting the research system but also inflating a huge publication bubble. The warning lights are long on. China has already realized the problem and may be soon taking action. Why not Europe? Will we wait until this bubble bursts?

Wicked rules pervert communities, so let's just adopt better rules. In 10 years the science publishing panorama will be unrecognizable anyway.

Source: Science Mag. 


PD: Interesting discussion in the comment section of this column in last week's Nature.

PD2: Ironically, a journal called Bubble Science just went closed earlier this year.

PD3: A new metric proposed: Author Impact Factor: tracking the individual scientific impact, by Kumar Pan & Fortunato. link

PD4: Key literature: The coupling between devaluation of writing in scientifi c authorship and infl ation of citation indices by Terry Engelder: https://rock.geosociety.org/net/gsatoday/archive/17/7/pdf/i1052-5173-17-7-44.pdf

PD5: A new journal now allows publishing citable articles of less than 200 words with a DOI. What next? Citable tweets?

PD5b: A paper reinventing the trapezoidal rule https://t.co/CANpYZ8GkX published in high-impact journal & has 268 citations pic.twitter.com/ECI04VaoQ3 — ∆ Garcia-Castellanos (@danigeos) January 28, 2016

PD6: A PosOne paper by V. Vavryčuk including some references on this: "Fair ranking of researchers and research teams" https://dx.plos.org/10.1371/journal.pone.0195509.

PD2022: China is now the first country by number of peer review publications as well as by most-cited articles. Thousands of scientists publish a paper every 5 days and the number of such authors has multiplied by 20 over 15 years.

2013-11-27

How old is Earth Science?

Many geoscientists think of their field as not much older than Lyell or Hutton; as a science that bloomed sometime during the eighteenth century. Nevertheless, the term geology was first used by Ulisse Aldrovandi in 1603 (Vai and Cavazza, 2003) and introduced as a regular term by Horace de Saussure in 1779. The danish scholar Nicolas Steno (1638-1686) set the bases for stratigraphy: the law of superposition and the principle of original horizontality.

But the roots of the scientific interest for the history of the Earth are even deeper than that.

Ortelius' world map, inspiring his own anticipation of
continental drift
In 1596 Abraham Ortelius, a flemish geographer serving the Spanish crown, wrote: "America (...) was (...) torn away from Europe and Africa, by earthquakes and flood" "the vestiges of the rupture reveal themselves: if someone brings forward a map of the world and considers carefully the coasts of the three aforementioned parts of the earth, where they face each other". This quotation extraordinarily anticipated by more than three centuries the theory of continental drift, but it remained forgotten and was rediscovered only in 1994.
Ortelius' idea was in turn a direct result of the vast exploration discoveries that took place in the previous decades. In the words of Alvarez & Leitao (2012, Geology): "The Iberian Voyages of Discovery of the fifteenth and sixteenth centuries marked a major advance in the understanding of the Earth—the greatest advance since antiquity, and comparable in scope and importance with the Geological Revolution, the Darwinian Revolution, and the Plate Tectonic Revolution, and we encourage geologists and other Earth scientists to embrace the Voyages as part of our geological scientific heritage."
This Edmund Halley’s map of geomagnetic declination (~1700 
AD) came about two centuries later than similar studies by 
Portuguese explorers, who used these magnetic anomalies for the 
long-lived challenge of determining longitude during navigation.

The practical drive behind those first geoscientific questions? In the 16th century, "the Portuguese began to make systematic surveys of magnetic declination by comparing the direction of a compass needle with the line of shadow of the Sun at local noon". Magnetic declination could in this way be used to estimate the geographical longitude, a fundamental navigation problem at the time which final solution had to wait for the eighteenth century, when accurate chronometers were first developed. In fact, it turns out that the phenomenon was well known since centuries earlier, and by 1492, Columbus first described the agonal line in the Atlantic Ocean, where the compass points exactly to the geographic pole.

In 1736, a franco-spanish expedition is set to south America to determine the size and shape of the globe, whether it is flattened or elongated at its poles, a long standing scientific question at the time. The expedition included Charles de La Condamine, Jussieu, Pierre Bouguer, Jorge Juan & Antonio de Ulloa. Several books were published out of these expeditions that had great novelty and impact at the time. Juan & Ulloa's (Relacion historica del viage a la America Meridional hecho de orden de S. Mag. para medir algunos grados de meridiano terrestre y venir por ellos en conocimiento de la verdadera figura y magnitud de la tierra, con otras observaciones astronomicas y phisicas), was published 3 years after La Condamine's but showed far more detail, maps and illustrations.
Juan & Ulloa's cover, 1748


In summary, the systematic study of the Earth has a history behind as long as in any other scientific field. Quoting again A&L: geoscientists can "trace their intellectual ancestry back to the Copernican Revolution of the 16th and 17th centuries, just as astronomers and physicists do".

References:
  • Alvarez & Leitao, 2010, Geology, 38, 231–234, doi: 10.1130/G30602.1
  • Romm, James, Nature 367, 407-408, 1994, A new forerunner for continental drift. doi:10.1038/367407a0
  • G. B. Vai et W. Cavazza, ed, Four centuries of the word 'Geology', Ulisse Aldrovandi 1603 in Bologna, Minerva Edizioni, Bologna, 2003

2012-03-15

Seafloor spreading, magnetic reversals, and plate tectonics

Doing science consists of formulating refutable hypotheses, this is, new interpretations based on former experience that lead to predictions that can be either confirmed or falsified (by future research).

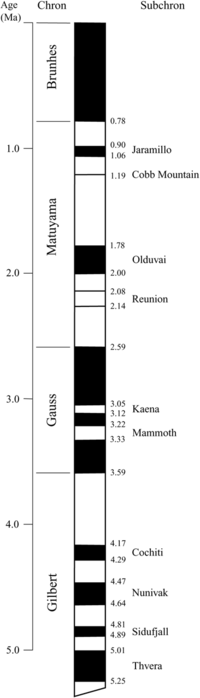
Timing of the last reversals of the Earth's
magnetic field. Time goes from 5 Million 
years ago (bottom) to present (top).
Periods in black match today's polarity;
periods in white underwent reversed polarity. 
Source: Wikimedia Commons. A more complete scale here.
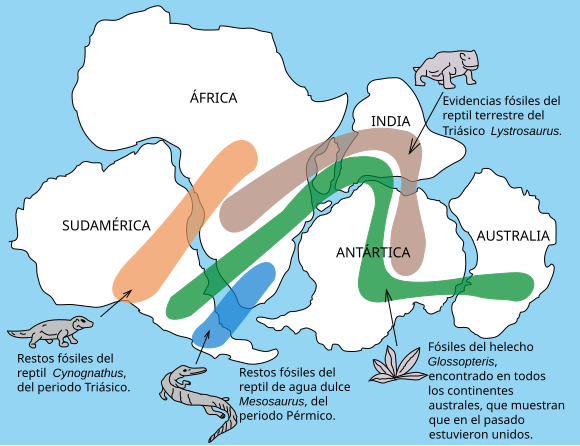
A case history in Earth science is the confirmation of the plate tectonics theory during the 60's. Back in 1912, this theory was just a hypothesis known as continental drift and put forward most remarkably by Alfred Wegener, based on observations of the fossil fauna matching across different continents. Well, in addition to the matching coastlines of continents pointed out by Abraham Ortelius as early as in the... 16th century!

One implication of the continental drift idea was that the oceans laying between continents that drifted away from each other should have gradually spread apart. This is known as the seafloor spreading hypothesis. But how to prove it?

Much earlier than that, the Earth's magnetic field had been studied scientifically since the beginning of the Spanish and Portuguese explorations of the Americas (Alvarez & Leitao, 2010, Geology, The neglected early history of geoscience). By the 17th century, maritime trading was dependent on the accurate mapping of magnetic intensity across the Atlantic Ocean. These studies culminated by the 19th century during the so-called Magnetic Crusade, leading to the realisation that the magnetic poles migrate significantly over historical time periods. And in fact, these rapid changes of the magnetic field soon became one of the theories proposed to explain why the magnetic orientation recorded in rocks depends on their geological age.

North Magnetic pole wander from 1590 to 2015. Click on the pins to see the year. From the GUFM and IGRF models. Via NOAA.

Today we know that historical magnetic changes are normal in periods of stable magnetic polarity, and that although the polarity flips recorded in rocks take just a few thousand years, they occur only over geological time-scales (millions of years).
Computer model based on Glatzmaier & Roberts. Magnetic field lines are in blue
when the field points towards the center and yellow when pointing away from it. The
rotation axis of the Earth is centered and vertical. The dense clusters of lines are
within the Earth's core

Back in 1957, Marie Tharp found enigmatic alignments in the shape of the seafloor around the center of the Atlantic Ocean, roughly where seismicity was being detected. In 1963, both the geophysicist Frederick J. Vine and the geologist Lawrence W. Morley independently realized that if the seafloor spreading theory was correct, then the rocks surrounding mid-oceanic ridges should show symmetric patterns of magnetization reversals, recording the changes of the Earth's magnetic field in the volcanic rocks at the time when these erupted and cooled down at the mid-ocean ridges. This is  now known as the Vine–Matthews–Morley hypothesis, and became a validation test for the seafloor spreading, and for the plate tectonics theory in general.

Seafloor spreading at a mid-ocean ridge, recording time-changes of geomagnetic 
field polarity. Source: Wikimedia Commons.
Morley's letters to Nature (February 1963) and to the Journal of Geophysical Research (April 1963) were both rejected, so Vine and his advisor Matthews were first to publish the hypothesis on the same year. The patterns of ancient reversals of the Earth's magnetic field have been found thereafter in hundreds of paleomagnetic surveys, providing a robust validation of their hypothesis. In fact, a vast later work of age calibration of these magnetic reversals allowed for the detailed maps of the age of the oceanic floor that we have nowadays:
Map of the age of the seafloor based on the reversal of the magnetic field
recorded in the oceanic crust during its formation at mid-oceanic ridges.
Red indicates a young seafloor, whereas blue is used for the oldest oceanic crust.
(Source: National Geophysical Data Center)

Magnetic reversals are still today one of the key methods allowing rock dating (don't miss the name for it: magnetochronostratigraphy). But we know very little about the mechanisms responsible for these magnetic field changes. Computer simulations suggest that it is a natural result of feedback forces between the magnetic field and the flow in the Earth's core (see the reference to Glatzmaiers' below), similar to dynamo going tilted by its own magnetic field. It has been recently shown in this article in GRL a correlation between the distribution of tectonic plates and the frequency of magnetic reversals over geological time ("geological intervals characterized by an asymmetrical distribution of the continents with respect to the equator are followed by intervals of high reversal frequency"), suggesting a mechanical coupling between both phenomena. But the specific mechanism behind magnetic reversals and the additional information they may contain about the interior and the past of our planet remain, so far, a challenge (yet another Reto Terrícola!).

Update (2015-09): A Science News article on a recent study on core convection and the magnetic field.


The origin of the Earth's magnetic field 
explained in 9 minutes.


References:

Vine, F., & Matthews, D. (1963). Magnetic Anomalies Over Oceanic Ridges Nature, 199 (4897), 947-949 DOI: 10.1038/199947a0

Pétrélis, F., Besse, J., & Valet, J. (2011). Plate tectonics may control geomagnetic reversal frequency Geophysical Research Letters, 38 (19) DOI: 10.1029/2011GL048784

Glatzmaiers, G., & Roberts, P. (1995). A three-dimensional self-consistent computer simulation of a geomagnetic field reversal Nature, 377 (6546), 203-209 DOI: 10.1038/377203a0

2012-01-06

Centenario de la teoría de la deriva continental

Hoy hace un siglo, el 6 de enero de 1912, Alfred Wegener presentó su teoría de la deriva continental en una conferencia ante la Asociación Geológica en Frankfurt. La idea de que los continentes se desplazan cambiando la configuración de tierras y mares fue polémica desde el principio, pero acabó imponiéndose como el hito clave de la historia de la geociencia, un cambio de paradigma que abrió las puertas a una infinidad de nuevos conceptos: la dinámica terrestre, la evolución del relieve, su relación con la evolución biológica, la edad de la Tierra...
Correlación de antiguas especies animales y vegetales entre continentes actualmente separados.

Wegener no encontró un mecanismo para explicar la deriva de los continentes. Tampoco fue el primero en imaginar la téctónica de placas, pues por ejemplo el geógrafo Abraham Ortelius, nada menos que en 1587, ya había sugerido que Sudamérica y Africa estuvieron unidos en un pasado remoto. Su mérito, como el de muchos científicos de renombre, fue reunir toda la evidencia multidisciplinar posible en su época para sostener de forma convincente su hipótesis. Su teoría a disfrutar del consenso entre geofísicos y geólogos hasta el descubrimiento de las alineaciones topográficas (el trabajo de Marie Tharp en 1957), la concentración de sismos y alineaciones magnéticas (descritos por Vine y Morley en 1963) en el centro del Océano Atlántico. Wegener ya no pudo disfrutarlo. Pero todo encajaba: las alineaciones quedaban grabadas en las dorsales oceánicas durante su expansión, reflejada en la actividad sísmica. El desarrollo de medidas del campo magnético grabado en las rocas ha permitido reconstruir la posición de los continentes a lo largo del tiempo geológico y desarrollar la moderna teoría de la tectónica de placas. Hoy la teoría de la tectónica de placas es aceptada por la inmensa mayoría de la comunidad geocientífica, apoyada por infinidad de otras evidencias, y es la base sobre la que se asienta la mayoría de los estudios de lo que ocurre en la Tierra en escalas de tiempo de millones de años.
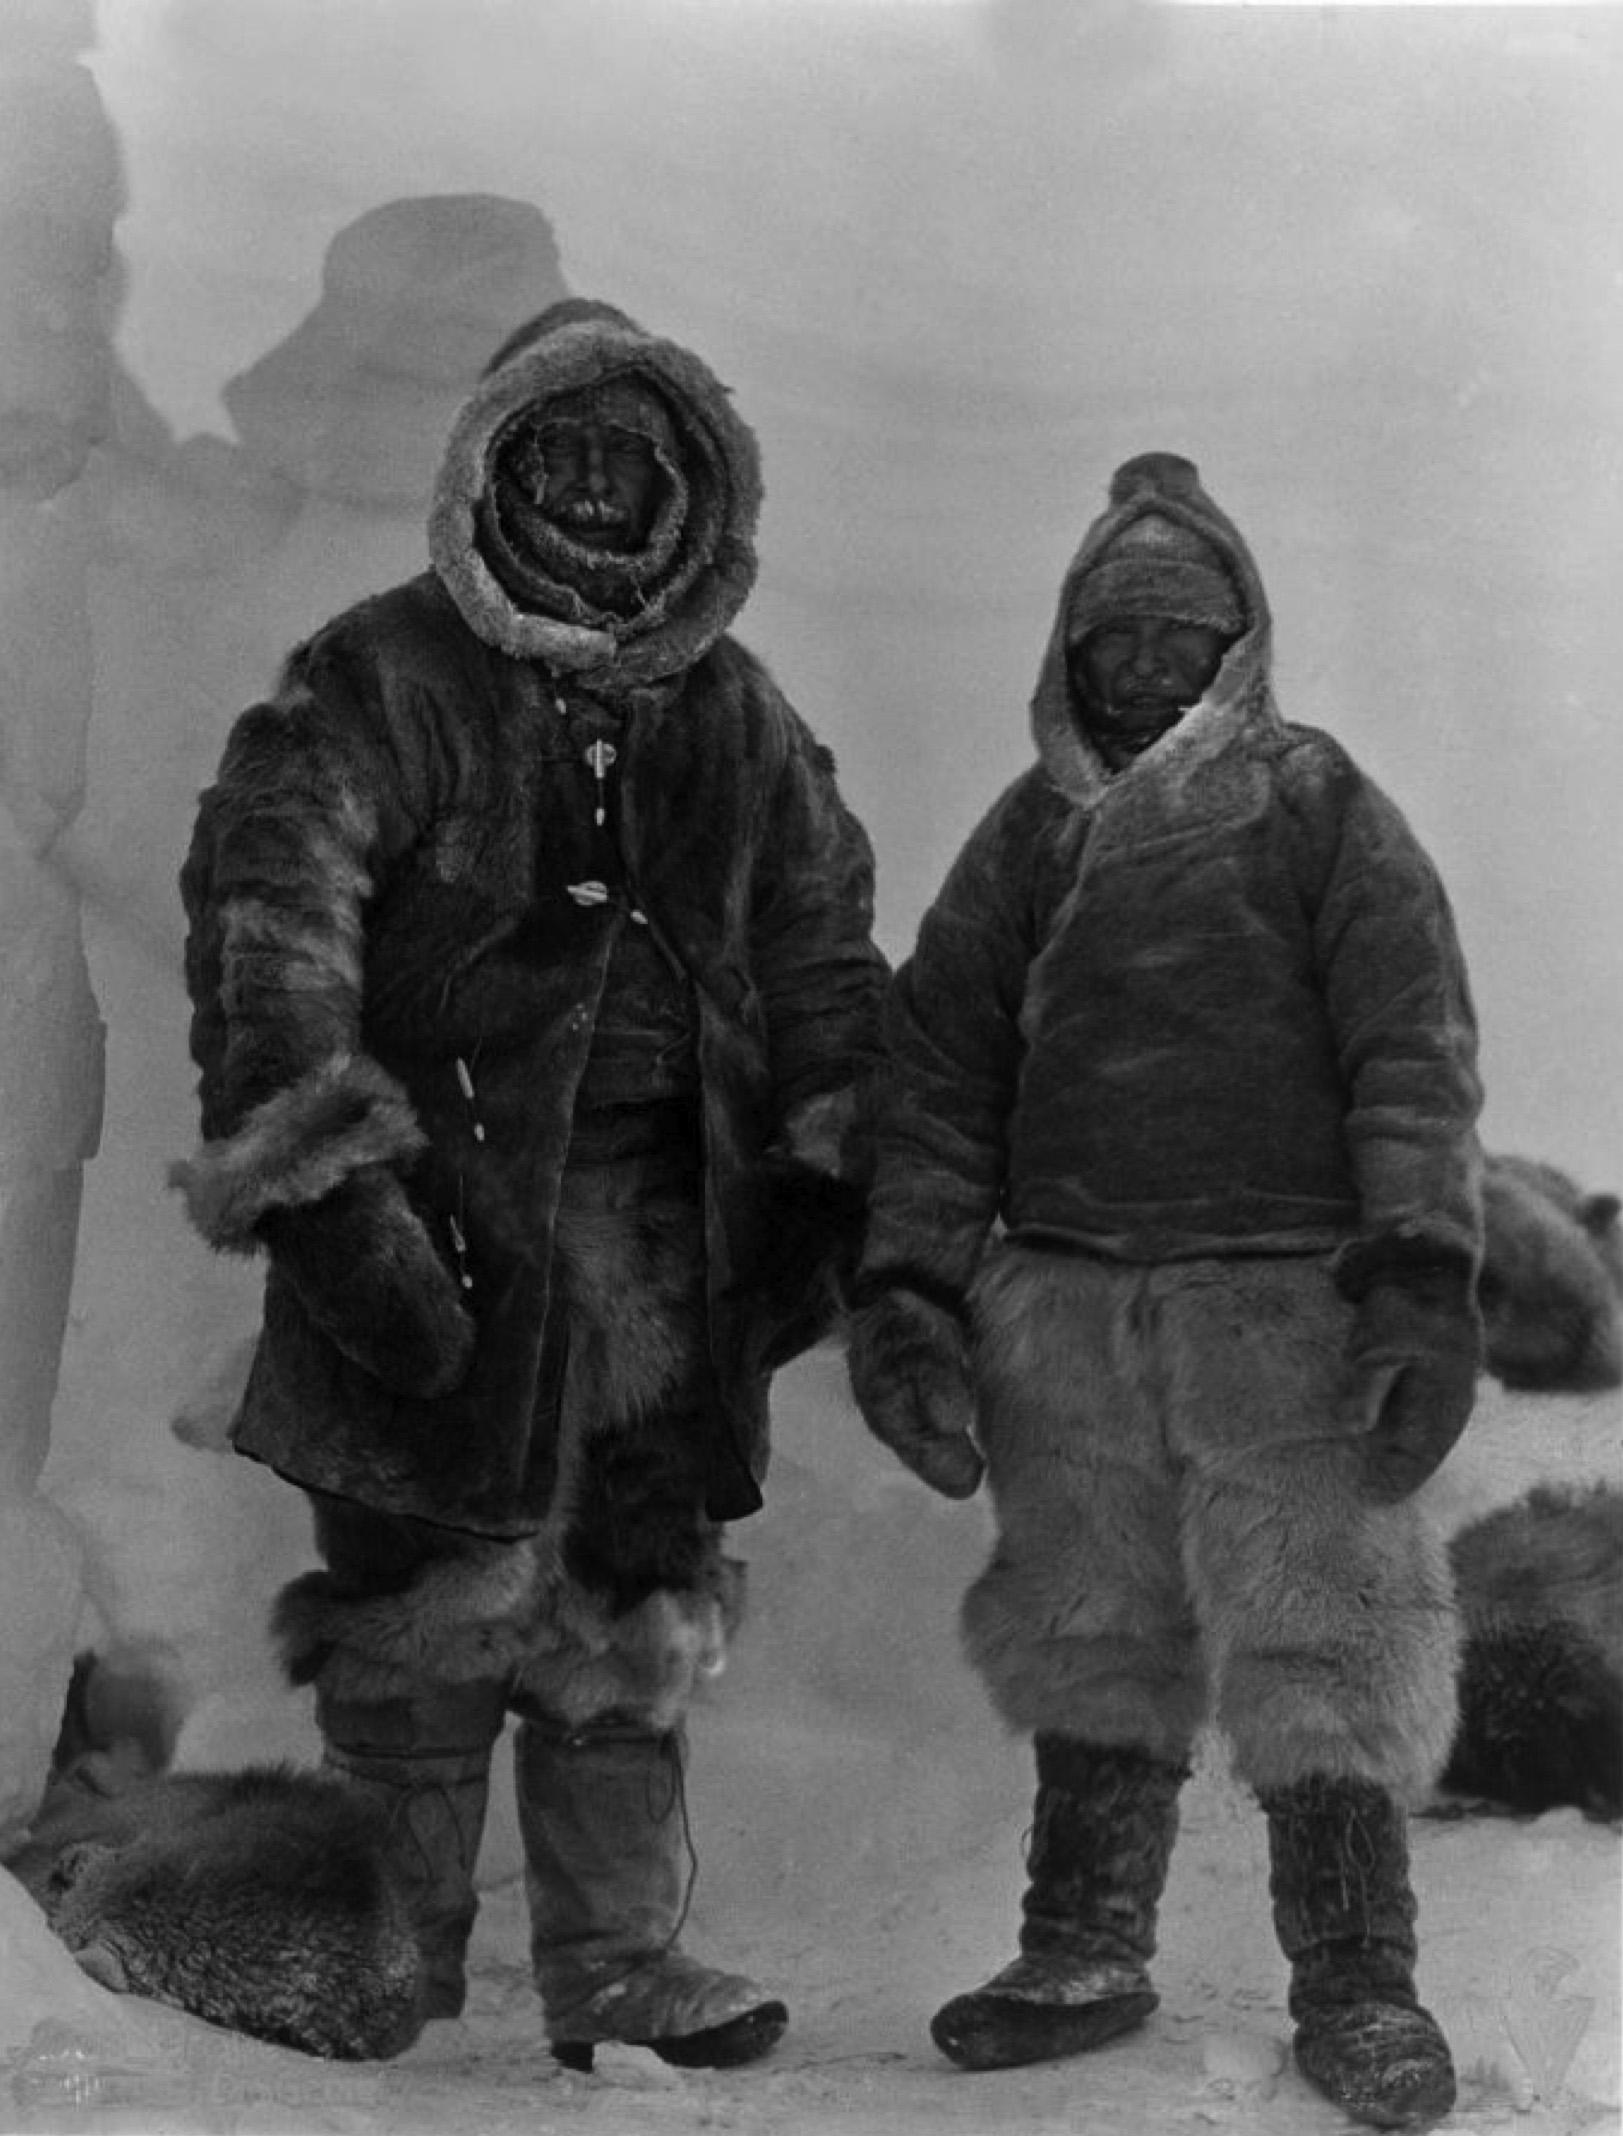
Wegener y el esquimal Rasmus Villumsen 
en una de sus últimas fotografías. 
Groenlandia, 1930.
(Fuente: Alfred Wegener Institute).
Wegener murió durante una expedición en Groenlandia en 1930. Allí continúa todavía su cuerpo, hundiéndose lentamente en el hielo glaciar y fluyendo con él hacia el mar, donde un día flotará en un enorme iceberg a la deriva.


[Hay una entrada sobre Wegener en Amazings sobre el centenario de la deriva continental, por Marcos A. Castro: Sobre Alfred Wegener en el centenario de la teoría de la deriva continental]

2011-05-31

70th Anniversary of Wegener's death

Alfred Wegener, el principal impulsor de la teoría de la deriva continental y la tectónica de placas (la base de la geología actual), murió en el ártico en 1931 y allí permanecen sus restos, desaparecidos en algún lugar bajo el hielo.
'We stand against [the earth] like the judge stands against a defendant who refused to give any information, and we have the task to reveal the truth by circumstantial evidence.' From 'Die Entstehung der Kontinente und Ozeane' (Alfred L. Wegener, 1929).
12, May 1931 the body of Alfred Wegener is found on the ice of Greenland, the remaining members of the expedition led by Kurt Wegener, Alfred´s brother, use a drill pipe to mark the grave with a cross. They respected Wegener´s love to the Arctic and buried him in the ice he had studied for many years and on various expeditions (photography by the Alfred Wegener Institute).
[Extraído de History of Geology]

2010-02-01

Pliny on the formation of the Gibraltar Strait

Earliest cultures inhabiting southern Spain had their own saying on how the Gibraltar Strait was formed, and it was not so different from today's!  Here comes some kind of Mediterranean refill theory as accounted by Pliny:
"At the narrowest part of the Straits, there are mountains placed to form barriers to the entrance on either side, Abyla in Africa, and Calpe [present Gibraltar Rock] in Europe, the boundaries formerly of the labours of Hercules. Hence it is that the inhabitants have called them the Columns of that god; they also believe that they were dug through by him; upon which the sea, which was before excluded, gained admission, and so changed the face of nature."
From Pliny's Historia Naturalis, vol. 3 (preface), ~77 AD

Amazing, ha? Was this anticipation of the flooding theory of the Mediterranean inspired by evidences that suggest a desiccation of the Mediterranean such as the widespread presence of salt we see today? Or was just inspired by the strong inflow currents well known by sailors at that time?