Showing posts with label Climate. Show all posts

2016-04-27

Glacier retreat in southern Iceland

Looking at old pictures, I realise that I had a first-hand glance at the retreat of the Jökulsárlón glacier (S. Iceland) back in 2013. I took these two pictures from the same spot with an 18-years time lag. Although the first one is taken in August and accordingly shows less snow in the background mountains than the more recent one, the latter does show the glacier front retreated by about 3 km. I pasted the Landsat images for comparison.


Not that this is a surprise, really: 
But i had to share.
In the meanwhile, I found this other JAXA (Japan) link as well. 

2015-08-06

Continental-scale evolution of topography and river networks. Tectonics and climate shaping Eurasia

[This post is about our recent publication on PLOS ONE]

How much does the erosion and sedimentation at the Earth’s surface influence on the patterns and distribution of tectonic deformation? This question has been mainly addressed from a computer modelling perspective, at scales ranging from local to orogenic. In the PLOS ONE paper published today, we present a model that aims at understanding this phenomenon at the continental scale, looking at the feedbacks between continental enlargement and climate aridification during the collision of continents.

60-million-year indentation of a continent from the south 
(at 50 mm/yr). 

Left: Topography and areas with precipitation
higher than 400 mm/yr (red shading). Note the 
orographic rainfall developing at the southern flank 
of the growing plateau. Wind blows from the southeast 
(towards the upper left corner).

Right: erosion and sedimentation rates, and
contours of crustal thickening rate due to tectonics. 

By Garcia-Castellanos & Jimenez-Munt, PLOS ONE, 2015. 
+ info here.

We couple a thin-sheet viscous model of continental deformation with a stream-power surface transport model. The model also incorporates flexural isostatic compensation that permits the formation of large sedimentary basins and a precipitation model that reproduces basic climatic effects such as continentality and orographic rainfall and rain shadow. We calculate the feedbacks between these four processes acting at different scales in a synthetic scenario inspired and scaled by the India-Asia collision. The model reproduces first-order characteristics of the growth of the Tibetan Plateau as a result of the Indian indentation.


Note that the southern continent (the indenter, India)
is chosen fixed to our reference frame, whereas
 the northern continent (Asia) is moving southwards). 


The initial topography is flat with small random noise
forming a network of lakes. 
The tectonic indenter in
the southern boundary represents India, while a rigid
block fixed around x=2500km represents the Tarim Basin. 


Wind blowing from SE at 7 m/s (relative humidity=1).
Red shading indicates orographic precipitation.


The continental deformation adopts a thin-sheet tectonic
model. 
+ info here.
What these simulations show is that, at large space and temporal scales, the climate dryness that develops in continental interiors triggers the trapping of sediment in closed basins within the continent, instead of exporting it to the continental margins. In the left panel you can see a large intramountain basin (comparable to the Tarim Basin) developing within Asia when a hard lithospheric region in predefined within the continent. The amount of sediment trapped in it is very sensitive to climatic parameters, particularly to evaporation, because it crucially determines its endorheic/exorheic drainage. We identify a feedback between erosion and crustal thickening leading locally to a <50 at="" climatically-enhanced="" concentrated.="" corners="" deformation="" flank="" growing="" in="" increase="" indenter="" is="" of="" orographic="" p="" place="" places="" plateau="" precipitation="" preferentially="" rates="" specially="" syntaxes="" takes="" the="" this="" upwind="" where="">
We hypothesize that this may provide clues for better understanding the mechanisms underlying the intriguing tectonic aneurysms documented in the Himalayas. At the continental scale, however, the overall distribution of topographic basins and ranges
seems insensitive to climatic factors, despite these do have important, sometimes counterintuitive effects on the amount of sediments trapped within the continent. The dry climatic conditions that naturally develop in the interior of the continent, for example, trigger large intra-continental sediment trapping at basins similar to the Tarim Basin because they determine its endorheic/exorheic drainage. These complex climatic-drainage-
tectonic interactions make the development of steady-state topography at the continental scale unlikely.

2014-03-26

49 Open Challenges in Earth Science - The Known Unknowns

Mapping Ignorance
ResearchBlogging.org
What keeps Earth scientists busy? These 49 open scientific questions aim at providing an updated, fully-referenced account of the main current scientific questions, disputes, and challenges in Geoscience.


[updated version in this link]


The Early Earth and the Solar System

Advances such as those occurred in the geochemistry of meteorites lead to new exciting hypotheses about the early stages of our planet, but as usual, answers are outnumbered by the new knowledge gaps: 
  1. How did the Earth and other planets form? Were planets formed in situ? Or are orbital changes relatively frequent? What determined the different deep layering of the solar planets? [McKinnon, 2012, Science on Mercury] 
  2. Was there ever a collision of the Earth with another planet Theia, giving birth to our satellite? [Canup, 2013, Science] There is compelling evidence, such as measures of a shorter duration of the Earth's rotation and lunar month in the past, pointing to a Moon much closer to Earth during the early stages of the Solar System. [Williams, CSPG Spec. Pubs., 1991]
  3. What is the long-term heat balance of Earth? How did its internal temperature decay since it formed by accretion of chondrites? How abundant are radiogenic elements in the interior? Did a "faint young sun" ever warm a "snowball Earth"? [WiredMarty et al., 2013, Science]
  4. What made plate tectonics a dominant process only on Earth? [outreach paper] How did the planet cool down before plate tectonics?[Moore & Webb, 2013, Nature] Was the Earth's crust formed during the early stages of its evolution or is it the result of a gradual distillation of the mantle that continues today along with crustal recycling? Is the crust still growing or does its recycling compensate for crust formation at mid-ocean ridges and other volcanic areas?
  5. How inherent to planetary evolution is the development of life conditions? [Zimmer, 2005, ScienceElkins-Tanton, 2013, Nature] Earth-like planets are now known to be abundant in our galaxy (two out of three stars may have one [e.g., Cassan et al., 2012, Nature]), but how many of them develop widespread durable water chemistry? How much of our water supplied by comets or asteroids? When and how did it reach the Earth? [outreach article]

Earth’s Interior

Our rock-sampling reach is limited to the upper 12 km of the Earth's crust, but the keys to extend our knowledge often lay far deeper than that. Indirect measurements such as seismic wave tomography, together with geodynamic and petrological modeling, become crucial: 
  1. What are the chemical composition and mechanical properties of rocks in the Earth’s mantle at the extreme pressure and temperature they undergo? As planets age and cool off, their internal and surface processes coevolve, chemically and mechanically, shaping also the atmospheric composition. Therefore this question has direct implications for our understanding of the environmental evolution of the Earth. [Kerr, 2005, Science]
  2. What are the dynamic processes in the Earth interior that accommodate and fuel plate tectonics? As seismometers spread more evenly over the planet's surface, the seismic imaging of the interior will rapidly improve, providing a detailed distribution of seismic wave velocity. Simultaneously, lab-based mineral physics must better constrain what these mechanical wave velocities tell us about the hot, deep rocks of uncertain composition in the mantle. Only then will computer models be able to test the proposed geodynamic models by trying to fit quantitatively those data and other geophysical observations such as gravity variations. [ref.3]
  3. Sedimentary and volcanic rocks have recorded changes of the magnetic field throughout the evolution of the Earth. What causes the sudden reversals of the paleomagnetic field? How does the geomagnetic field link to the iron convection properties at the deep Earth? Or inversely, what can we learn about the mechanical behavior of the materials at those depths from the geomagnetic field? [more context in Nature] Are the magnetic reversals too fast to be related to core dynamics? [example.1] [ex.2] [ex.3] Could their frequency be related to the distribution of tectonic plates? [GRL article]. What causes superchrons (periods longer than 10 Myr without magnetic reversals)? Something internal to the core, or induced externally by the mantle/subducting slabs? Was the geomagnetic field always dipolar, or was it more asymmetric in the past? [introduction]
  4. Are intraplate hotspots really made by deep sources of uprising materials (mantle plumes) coming from the deepest Earth's mantle? Or can they be explained by shallower convection? [e.g., Morgan, 1971; see also this recent Geology paper on Yellowstone].
  5. What is the history of and what controls the excursions of the rotation pole relative to the surface geography, known as true polar wander? [ex]
  6. What are the properties of deep rocks? How can we translate the heterogeneity in density, seismic wave velocity, or electromagnetic resistivity presently observed in the mantle and the lithosphere into variations of the mineralogical composition? And how do these measures relate to the dynamics of the Earth and to key mechanical properties such as the viscosity? [Faccenna & Becker, 210, Nature]. 
  7. What are the causes for Large Igneous Provinces and massive flood basalts such as the Columbia River Basalts?

Tectonic-plate motion and deformation 

The successful adoption of the plate tectonics paradigm has lead to a myriad of new questions about its limits and about the lessons for risk mitigation.
Velocity of the earth's surface at the Indian-Asian collision,
from GPS data. Blue star indicates the 2008 China earthquake.
Source: CALTECH
  1. What is the relative importance of the forces driving plate tectonics: slab pull, slab suction, mantle drag, and ridge push? [e.g., Conrad & Lithgow-Bertelloni, 2004; Negredo et al., GRL, 2004, vs. van Benthem & Govers, JGR, 2010]. What is the force balance and the geochemical cycle in subduction zones? [Emry et al., 2014, JGR] How much water (and how deep) penetrates into the mantle? [Ranero et al., 2003, Nature] How much subcontinental erosion takes place under subduction areas? [Ranero et al., 2000, Nature]
  2. What happens after the collision of two continents? Does continental collision diminish the rate of plate subduction, as suggested by the slab-pull paradigm? [Alvarez, EPSL, 2010How frequent are the processes of mantle delamination and slab break-off? What determines their occurrence? [Magni et al., GRL, 2013; Durezt & Gerya, Tectonoph., 2013]
  3. Why are orogens curved when seen from space? [Weil & Sussman, 2004, GSASP 383]
  4. How does the long-term deformation derived from paleomagnetism and structural geology link quantitatively to the present-day motions derived from GPS and from neotectonic patterns of crustal deformation? [Calais et al., EPSL, 2003] How do these last two relate to each other? [ref] Can we learn from regional structure of the crust/lithosphere from that link (or viceversa)? 
  5. Are plate interiors moving in steady-state linear motion? How rigid are these and why/when did they deform? [Davis et al., (2005) doi:10.1038/nature04781, and Wernicke & Davis, (2010) doi:10.1785/gssrl.81.5.694]
  6. How is the relative motion between continents accommodated in diffuse plate boundaries? (eg., the Iberian/African plate boundary). What determines the (a)seismicity of a plate contact? 
  7. How/when does deformation propagate from the plate boundaries into plate interiors? [e.g., Cloetingh et al., 2005, QSR] 
  8. What is the rheological stratification of the lithosphere: like a jelly sandwich? Or rather like a creme brulée? [Burov & Watts, 2006]. Is the lower crust ductile? Is strength concentrated at the uppermost mantle? Or just the other way around? [e.g., McKenzie et al., 2000, JGR; Jackson, 2002, GSA TodayHandy & Brun, 2004; and a nice recent post]
  9. Add caption
      Does the climate-controlled erosion and surface transport of sediment modify the patterns of tectonic deformation? Does vigorous erosion cause localized deformation in the core of mountain belts and prevent the propagation of tectonic shortening into the undeformed forelands? Does the deposition of sediment on the flank of mountains stop the frontal advance of the orogen? Is there any field evidence for these effects predicted from computer models? [Philip Allen's blog] [Willett, 1999, JGRWhipple, 2009Garcia-Castellanos, EPSL, 2007]
    1. Can earthquakes be predicted? [Heki, 2011, GRLFreed, 2012, Nat.Geosc.]. How far away can they be mechanically triggered? [Tibi et al., 2003, Nature]. Little is known about how faults form and when do they reactivate [ex.6], and even worse, there seems to be no clear pathway as to solve this problem in the near future. Unexpected breakthroughs needed. 
    2. How can the prediction of volcanic eruptions be improved? What determines the rates of magma accumulation in the chamber and what mechanisms make magmas eruptible? [ex.7][ex.7b]
    3. In many regions, the elevation of the continents does not match the predictions from the classical principle of isostasy for the Earth's outer rigid layer (the lithosphere). This deviation is known as dynamic topography, by opposition to isostatic topography. But what are the mechanisms responsible? Can we learn about the mantle dynamics by estimating dynamic topography? [ref.1Can the hidden loads needed to explain the accumulation of sediment next to orogens (foreland basins) be linked to these dynamic forces? [Busby & Azor, 2012, Wiley]
    4. How do land-forming processes react to climate change at a variety of scales, ranging from the Milankovitch cycles to the late Cenozoic cooling of the Earth? Is there a feedback from erosion into climate at these time scales, through the Carbon cycle and the weathering of silicates, for example? What is the role of the surface uplift and erosion of Tibet on the drawdown of atmospheric CO2 over the Cenozoic? [Garzione, 2008, Geology]

    Earth's landscape history and present environment

    The shape of the planet's solid surface, its topography, is the key feature that connects many of the disciplines within Earth science, probably because it is the feature that most affects our daily life. It is today common wisdom that landscape forms from a complex interplay between tectonics and climate, through a list of mechanical, chemical, and biological processes acting at the surface of the Solid Earth. Topographic data is becoming now available at resolutions finer than a few meters, and the sedimentary record is also being archived at unprecedented rates. But:
    Drainage patterns in Yarlung Tsangpo River, China (NASA)

    1. Can we use these data to derive past tectonic and climatic conditions? Will we ever know enough about the erosion and transport processes? Was also the stocasticity of meteorological and tectonic events relevant in the resulting landscape? And how much has life contributed to shape the Earth's surface? 
    2. Can classical geomorphological concepts such as 'peneplanation' or 'retrogressive erosion' be understood quantitatively? Old mountain ranges such as the Appalachian or the Urals seem to retain relief for > 10^8 years, while fluvial valleys under the Antarctica are preserved under moving ice of kilometric thickness since the Neogene. What controls the time-scale of topographic decay? [Egholm, 2013, Nature]
    3. What are the erosion and transport laws governing the evolution of the Earth’s Surface?[Willenbring et al., Geology, 2013] Rivers transport sediment particles that are at the same time the tools for erosion but also the shield protecting the bedrock. How important is this double role of sediment for the evolution of landscapes? [Sklar & Dietrich, Geology, 2001 (tools and cover effect); Cowie et al., Geology, 2008 (a field example)].
    4. Can we predict sediment production and transport for hazard and scientific purposes? [NAS SP report, 2010Geology, 2013] 
    5. Smaller-scale patterns at the limit
      between river channels and hillslopes.
      Credit: Perron Group, MIT
    6. What do the preserved 4D patterns of sediment flow tell us from the past of the Earth? Is it possible to quantitatively link past climatic and tectonic records to the present landforms? Is it possible to separate the signals of both processes? [e.g., Armitage et al., 2011, Nature Geosc]. 
    7. Can we differentiate changes in the tectonic and climate regimes as recorded in sediment stratigraphy? Some think both signals are indeed distinguishable [Armitage et al., 2011, Nat.Geo.]. Others (Jerolmack & Paola, 2010, GRL], argue that the dynamics intrinsic to the sediment transport system can be 'noisy' enough to drown out any signal of an external forcing. 
    8. Does surface erosion draw hot rock towards the Earth’s surface? Do tectonic folds grow preferentially where rivers cut down through them, causing them to look like up-turned boats with a deep transverse incision? [Simpson, 2004, Geology]
    9. How resilient is the ocean to chemical perturbations? What caused the huge salt deposition in the Mediterranean known as the Messinian Salinity Crisis? Was the Mediterranean truly desiccated? What were the effects on climate and biology, and what can we learn from extreme salt giants like this? [e.g., Hsu, 1983Clauzon et al., Geology, 1996; Krijgsman et al, 1999, NatureGarcia-Castellanos & Villaseñor, Nature, 2011]. Were the normal marine conditions truly reestablished by the largest flood documented on Earth, 5.3 million years ago? [Garcia-Castellanos et al., 2009, Nature]
      Artistic view of the refilll of the
      Mediterranean after the Messinian salinity
      crisis. Authors: Pibernat & Garcia-Castellanos.
      Downloadable here.
    10. How do the patterns of river networks form? [eg. Devauchelle et al., 2012, PNAS; Perron et al., 2012, Nature]. And what information about the past do these patterns contain? Can we quantitatively reconstruct past ecology or climate from old river patterns? [e.g., Hartley et al., 2010, J. Sedim. Res.]
    11. Do we need a new geological epoch called Anthropocene? When do the Homo Sapiens start to have a significant impact on the Earth System? 8000 BP?[Ruddiman, 2003, Climatic Change]; 2000 BP? [Scalenghe, 2011, The Holocene]; 1850 AD? [Crutzen & Steffen, 2003]

    Climate, Life, and Earth

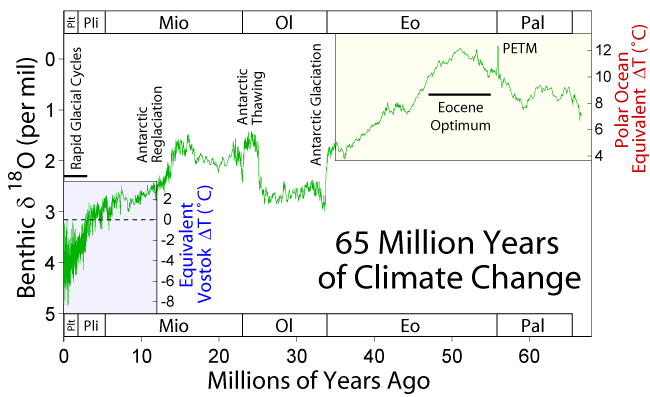
    Source: R.E..Rhode, Wikipedia
    The geological record shows that climate is relatively stable over tectonic time-scales whereas it undergoes abrupt changes in periods ranging from decades to hundreds of thousand years. Past periods when the planet underwent extreme climate conditions may help to understand the mechanisms behind that behavior and its significance for the evolution of the Solid Earth.

    1. What caused the largest carbon isotope changes in Earth? [Grotzinger et al., 2011, Nat. Geosc.] How does Earth’s climate system respond to elevated levels of atmospheric CO2? 
    2. Was there ever a snow-ball Earth during the earliest stages of Life on Earth? 
    3. Were there also rivers and lakes on Mars? [Hans, 2012] Were there large outburst floods similar to those on Earth
    4. What were the causes and what shaped the recovery from mass extinctions as those at the K-T boundary, the Permian-Triassic or the Late Triassic? Massive volcanism? Meteorites? Microbes? [recent papers: ex.8ex.9ex.10, Rothman et al., 2014, PNAS]
    5. What triggered the extreme climatic variability during the Quaternary and the roughly coeval acceleration in continental erosion and sediment delivery to the margins? [Peizhen, Molnar et al., 2001, Nature; Herman et al., 2013, NatureWas this related to the tectonic closure of the Central American Seaway? How do these climate events translate quantitatively into sea level changes?
    6. How do climate changes translate quantitatively into sea level changes? How do ice sheets and sea level respond to a warming climate? What controls regional patterns of precipitation, such as those associated with monsoons or El Niño?
    7. What caused the Quaternary extinction(s)? Human expansion? Climate Change? How sensitive are ecosystems and biodiversity to environmental change? Was the large fauna extinction ~13,000 yr ago a result of the Younger Dryas climatic event? Was this caused by an extraterrestrial impact? [ex.11ex.12] Or may it be linked to the outburst of Lake Agassiz
    8. How relevant are subsurface microorganisms to earth dynamics by controlling soil formation and the methane cycle? What are the origin, composition, and global significance of deep subseafloor communities? What are the limits of life in the subseafloor realm?  
    9. The atmosphere is shaped by the presence of life, a powerful chemical force. The Earth’s evolution has seems to affect the evolution of life [see the Cambrian explosion of animal life, for instance; plus this recent paper on that]. To what extent? And how much control has life on climate? [another recent one]. Is it possible to quantify these links to make reliable predictions that allow filling the data gaps or assessing the chances for extraterrestrial life?
    10. How much of the present climate change is anthropogenic? How will growing emissions from a growing global population with a growing consumption impact on climate? 

    Broader open questions


    1. Many of the questions above are related to the extreme diversity of spatial scales of Earth processes. Direct observation (by sampling or remotely) is mostly limited to a thin layer around the solid surface of the Earth, and physical experimentation is limited to the pressures of the uppermost layers of the planet. Many processes including plate tectonics are known to be driven by the nature of the materials that make up the planet interiors, down to the smallest atomic scales, as thought for instance for the trigger of earthquakes. Answers may arrive via new devices and analytical tools working at the high pressures and temperatures of Earth’s interior.
    2. Time scales also pose a problem to know the mechanical and chemical properties of Earth's materials. Partly because we deal with time scales in very different orders of magnitude while we are limited to make observations from the present. But also because scaling the rates of lab experiments (e.g., mineral physics) or analogue models (e.g., sandbox experiments) with the corresponding geological scenarios is not always convincing. 
    3. Implementing Episodicity in Gradualism: For historical reasons, geology has generally underestimated the role of episodicity in nature. However, there is a growing view that exceptional events and stochasticity have a relevant role in many of Earth's subsystems. An example for this is the preeminence of flooding events (larger than average) in erosion and surface sediment transport and during the evolution of landscape, and the importance of upscaling flood stochasticity into sediment transport models [eg., Lague, 2010, JGR]. Climate variability at all time-scales has been already mentioned above. Even plate tectonics may have been episodic (during the Archean at least, [ref]).  4D hyperscale data sets in geomorphology are increasingly showing the limits of smooth-process approaches. Future understanding of the Earth will benefit from incorporating the full frequency spectrum (the episodicity) in modeling natural phenomena, rather than systematically approaching these as gradual processes. 
    4. Computer models tell whether the complexity of nature can be explained by the interplay between simple processes, but: how can we further model the Earth as a complex system of complex systems? And when can we expect ‘compact’ explanations? 

    General background:
      Note that the specific references given above for each open question are sometimes just examples and may not always be the best representative. Furthermore, the list is surely biased towards Solid Earth Science, my own field. The following general references can give you an alternative perspective on the subject.
      Please send additions/suggestions to d.g.c@csic.es

      Acknowledgements:
      For various inputs/criticisms to this list: Brian Romans, Umberto Lombardo, Jean Braun, Mikael Attal, Alexandra Witze, Michael Klaas, Matt Hall, Chris Rowan.
      PD: I published a shorter version of this post in Mapping Ignorance. -Daniel

      2012-02-15

      Steady-state topography during orogenesis: Erosion vs. Tectonics competition

      I uploaded to Youtube a simple but interesting numerical model. It computes a constant tectonic uplift with the competing river erosion along a cross section, allowing enough time to reach two successive topographic steady states (one during uplift, another one after uplift):
      Steady state topography development, and other parameters of the model.
      Uplift occurs between x=-50 and x=+50 km. The dashed line indicates 
      the topographic profile that would develop in absence of erosion. 
      Equilibrium topography is reached at ~4 and at ~8 Myr.

      This is calculated assuming constant uplift rate at the center (x=-50 to +50 km) and a 1D stream power law erosion model. Uplift rate is 1 mm/yr and stops at t=5 Myr. River erosion is proportional to slope and water discharge. Precipitation rate is constant over the entire profile. Calculations are performed under Linux with the program tAo (Garcia-Castellanos, 2007, EPSL). +info and software download here: https://sites.google.com/site/daniggcc/software/tao

      As you can see, topographic growth goes on until a first steady state (with a maximum topography of ~3000 m) is reached before 5 Myr. If you look at the numbers, you'll see an equilibrium between erosion rates and uplift rates at that time. At 5 Myr uplift stops and then erosion leads to the new equilibrium: a flat topography (at 8 Myr).

      Now, the question is: does steady-state topography exist in nature? And if it does, can we recognize it? In real Earth, neither climate nor tectonics are constant through time. The questions are probably too big for this small blog, but you can find some hints in this article by Willett and Brandon (2001).

      Nevertheless, the notion of steady-state topography is useful to understand some basic principles of orogenesis, as Whipple (2009) showed in a very simple and elegant way. Consider these two end-member types of orogen:

      Evolution of for parameters (orogen width, erosion, topography, and rock uplift) for two simple models of orogenic growth. Left: fixed width orogen; Right: Self-similar growth. At t=0, the erosion coefficient is set to a double value (red) and to half of the reference value (green). Erosion is assumed proportional to elevation. The parameters are shown normalized. Redrawn from Whipple (2009).  
      Assume both orogens grow in response to the convergence of two tectonic plates, producing a constant tectonic flow Fa, and that they are eroded at a rate proportional to elevation. The red lines in the figures above correspond to a change to double erosion efficiency. With such a simple representation, it becomes clear that if erosion mechanisms become more efficient, both orogen types initially undergo an increase in erosion rate, but this will gradually decrease back to the initial erosion value (the one compensating the imposed tectonic flow, as in the animation above). The way the orogen returns to the original low erosion rate is by decreasing its elevation R.
      One interesting thing is that, whereas for a fixed width, rock uplift rates return to normal after some time, the self-similar growth predicts a permanent increase in uplift rates.
      And the other interesting conclusion is that the time response is controlled mainly by the erosion efficiency itself (within the approaches of the model, of course).

      Simple models are generally more inspiring than the most complex ones.

      References:

      Whipple, K. (2009). The influence of climate on the tectonic evolution of mountain belts Nature Geoscience, 2 (2), 97-104 DOI: 10.1038/ngeo413

      Willett, S., and Brandon, M. (2001). On steady states in mountain belts Geology, 30, 175-178

      2012-02-12

      2011 update to global warming

      [This post is basically excerpted from 2011 Updates to model-data comparisons, RealClimate, by gavin]

      Curious about the global temperature trend after updating with last-years temperature record?

      Mean-temperature rise since 1980
      Mean anomalies from the IPCC AR4 models plotted on surface temperature records (HadCRUT3vNCDC and GISTEMP). Everything is baselined to 1980-1999 and the envelope in grey encloses 95% of the model runs.
      The La Niña event in 2011 cooled the year relative to 2010. Differences between the observational records are mostly related to interpolations in the Arctic. Given current indications of only mild La Niña conditions, 2012 will likely be a warmer year than 2011, so again another top 10 year, but not a record breaker – that will have to wait until the next El Niño.

      Corrected for short-term processes
      Foster and Rahmstorf (2011) showed nicely that if you account for some of the obvious factors affecting the global mean temperature (such as El Niños/La Niñas, volcanoes etc.) there is a strong and continuing increasing trend. An update to that analysis using the latest data is available here.
      Ocean Heat Content
      Ocean heat content (OHC) in the models compared to the latest data from NODC. All curves are baselined to the period 1975-1989.

      Summer sea ice changes
      Sea ice changes this year were dramatic, with the Arctic September minimum reaching record values (depending on the data product). Updating the Stroeve et al, 2007 analysis (courtesy of Marika Holland) using the NSIDC data we can see that the Arctic continues to melt faster than any of the AR4/CMIP3 models predicted.


      2011-12-14

      The Messinian Salinity Crisis (3/3) - mechanisms for forming a huge salt pan

      [1st chapter of this post (1/3)]
      [2nd chapter of this post (2/3)]
      [Spanish version of this post]
        ResearchBlogging.org
      In two previous parts of this post I tried to summarize the evolution of the Messinian salinity crisis, the period of widespread salt precipitation in the Mediterranean. This 3rd part focuses on our own research, aiming at finding a mechanism to explain the long first evaporitic phase (Stage 1). 
      A key unknown that must be mentioned in advance is the depth of the last seaway that allowed the inflow of Atlantic water, the water that replaced the evaporation at the surface of the Mediterranean sea. Hydraulic calculations indicate that a too-shallow seaway (less than ~10 meters deep) would imply a reduction in Atlantic water supply and a drawdown of the Med's level (it would literally evaporate). In contrast, a seaway that was too deep (more than ~30 m) would allow too much mixing between both sides, contradicting the observed salt precipitation. Only intermediate values could allow uninterrupted salt precipitation during the first stage of the Messinian salinity crisis. But, how could the seaway keep in that narrow range of depths when global sea level changes are known to oscillate by several tens of meters? (See fig.3)
      1. Cartoon of the detachment and lateral tear propagation
      of a dense piece of lithosphere under the Betic
      Cordillera. Yellow arrows indicate forces related
      to the weight of the slab; white arrows show
      vertical motions induced by the tear propagation.
      One key obstacle to tackle this question is the lack of good constrains as to which was the last corridor connecting both sides of the Gibraltar Arc. There were several seaways crossing the Betics and the Rif, and all of them closed between 7 and 6 million yrs ago. These corridors are recorded in marine sediments showing paleocurrents and laying today several hundred meters above sea level. But the dating methods have been so far unsuccessful to resolve which was the last one to feed the Med with relatively fresh water.
      2. Geological map of the Betics and the Rif (S Spain, N Morocco) combined with tomographic images of the Earth's interior, reaching a 660 km depth. The vertical white arrows show the crustal uplift inferred from the altitude of marine sediments of early Messinian age. 
      As for the mechanism responsible for the uplift itself, hints come from isotopic analyses and datations of the volcanism in the Alborán Sea (Duggen, 2003), together with the images obtained via seismic tomography of the Earth's mantle structure. These suggest that the uplift and shrinkage of the seaway may have taken place by a known geological process: due to the detachment of a dense piece of lithosphere (slab break-off). The tomographic images (see figure) use the arrival time of earthquake waves to derive the internal structure of the Earth, and show a lithospheric slab detaching from the Earth's crust underneath the Cordillera Bética. As this body sunk in the upper mantle, it would tear apart (slab tear) and trigger an isostatic rebound of the overlaying Earth's crust. This could explain the uplifted marine sediments in the Betic and Rif cordilleras, providing the uplift rates needed for the closure of the seaways.
      3. Sea level changes in the last 8 million years (data from Miller & coauthors, 2005, Science, based on the oxygen isotopic content). The three red dots indicate the initiation of Stages 1 and 2, and the final reflooding of the Mediterranean (ages from Krijgsman et al., 1999). 
      But coming back to the essential problem of the mechanisms behind the salinity crisis: Tectonic processes as those discussed above are slow: to produce vertical motions of a few hundred meters they need at least hundreds of thousands of years. But sea level (see figure) changes by tens of meters in periods of a few thousand years. How could then the gateway remain in such a narrow depth range for more than 100,000 years? What kept the seaway neither too deep, nor too shallow in spite of the global sea level variations?
      4. Cartoon illustrating the competition between the tectonic uplift of the seaway and its erosion due to the water flow feeding the Mediterranean (Garcia-Castellanos & Villaseñor, 2011).

      Our study (Garcia-Castellanos & Villaseñor, 2011) is based on relatively simple hydrodynamic calculations  combined with erosion formulations that had been previously used for landscape modeling and river erosion studies. The results of combining these techniques to simulate the channel connecting the Mediterranean and the Atlantic show that the rate of erosion produced by the incoming waters that compensated the Mediterranean evaporation was similar to the tectonic uplift rate presumed for the Gibraltar Arc, suggesting that uplift and erosion may have been in equilibrium for a long period, keeping the connecting seaway at an approximately constant depth. The results also show that global sea level changes could also have been accommodated by erosion to some extent.  

      5. Two simulations as example. Dark lines show an evolution for a slow uplift (red for sea level; black for seaway depth), whereas the light lines are for a fast uplift. In both an equilibrium between erosion and uplift is reached, but the equilibrium decrease of the Mediterranean level required for the slow uplift is smaller than for the rapid uplift. The total amount of inflowing water is in both cases identical, the one that compensated the hydrological déficit of the Med (Garcia-Castellanos & Villaseñor, 2011).
      The model also predicts that this competition between uplift and erosion should normally occur out of phase, because the evaporation in the Med needs some hundreds or thousands of years to make the level fall. As a result, a cyclicity in terms of sea level and salt precipitation is predicted that could explain the intriguing cycles observed in the salt deposits all around the coast.
      Global sea level fluctuations probably competed with the tectonic uplift by modulating the erosion rates exerted by the overtopping atlantic waters into the Mediterranean (see the supplementary information in the original publication). 
      Results from the model:
      6. Equilibrium level of the Med as a function of the uplift of the seaway.  
      A possible summary (or the simplest one supported by our results) consists of 4 stages (dates from Krijgsman et al., 1999):
      • Stage 0 (before 5.96 million years BP). The Betic-Rifean island arc rose, shrinking the connections between Mediterranean and Atlantic. 
      • Stage 1 (5.96 Ma - ?). A last connection allows the inflow of Atlantic water, and erosion along this enters in competition with uplift, keeping the inflow roughly constant. The Mediterranean level descends some tens or hundreds of meters but it becomes quickly a saturated brine. 
      • Stage 2 (? - 5.33 Ma). Tectonic uplift exceeds seaway erosion and eventually disconnects the Mediterranean from Atlantic water supply. The Mediterranean goes dry, its level drops by 2 km. 
      • Stage 3 (5.33 Ma). The level of the Atlantic exceeds that of the Gibraltar land bridge and triggers a fast refill of the Med.


      7. Cartoon of the simplest evolution suggested for the Messinian Salinity Crisis from the modeling results. Stage one corresponds to a cancellation of the outflow from the Med to the Atlantic; Stage 2 is the presumable desiccation starting when the threshold of the seaway becomes above sea level; The Zanclean flood is the refill triggered as the Atlantic waters found a way over the lowest sill of the Gibraltar ARc. 
      The mechanism we propose for Stage 1 implies that the last corridor should undergo some hundred meters of erosion, carving a gorge while the surrounding mountains where rising. Finding this gorge nowadays won't be easy, since it has been probably overprinted by the landscape erosion taking place in the 6 million years passed since.
      8. Salinidad actual de la superficie de los oceános. La mayor salinidad del Mediterráneo se debe a la mayor evaporación e insolación isolation de sus aguas. Source: World Ocean Atlas 2005
      These findings and the extreme geological conditions imposed during th MSC period may help to understand the global change in response to abrupt environmental changes. Since the Mediterranean trapped about 10% of the global ocean salt in at least 100.000 yrs and probably underwent desiccation afterwards, the effects of this should be visible in the biology and climate, perhaps at a global scale. The migration of mammals using the new land bridge formed when the last corridor closed (including African camels that moved to near Valencia, for example) is well documented by paleontologists. But the impact in climate is more elusive from the observational point of view. If climatic data of the multi-million-year time-scale improve, they could allow a better calibration of the multiple parameters of global climate computer models. The desiccation of the Mediterranean offers a unique scenario, a natural laboratory for that calibration, and hence it may help to improve existing climatic models. 


      9. Artístic view of the surface and underground events during the early stages of the Mediterranean isolation.
      Author: Manuel Mantero; licencia CC-BY-SA 3.0.
      Update: The impact of the Messinian Salinity Crisis in exploration and Mediterranean resources will be the focus of a session at the forthcoming AAPG Conference in Barcelona, Spain, April 8-10, 2013 http://www.aapg.org/barcelona2013/

      References:
      • Krijgsman, W., Hilgen, F., Raffi, I., Sierro, F., & Wilson, D. (1999). Chronology, causes and progression of the Messinian salinity crisis Nature, 400 (6745), 652-655 DOI: 10.1038/23231
      • Duggen, S., Hoernle, K., van den Bogaard, P., Rüpke, L., & Phipps Morgan, J. (2003). Deep roots of the Messinian salinity crisis Nature, 422 (6932), 602-606 DOI: 10.1038/nature01553
      • Garcia-Castellanos, D., Estrada, F., Jiménez-Munt, I., Gorini, C., Fernàndez, M., Vergés, J., & De Vicente, R. (2009). Catastrophic flood of the Mediterranean after the Messinian salinity crisis Nature, 462 (7274), 778-781 DOI: 10.1038/nature08555
      • Garcia-Castellanos, D., Villaseñor, A. (2011). Messinian salinity crisis regulated by competing tectonics and erosion at the Gibraltar arc Nature, 480 (7377), 359-363 DOI: 10.1038/nature10651
      • Govers, R. (2009). Choking the Mediterranean to dehydration: The Messinian salinity crisis Geology, 37 (2), 167-170 DOI: 10.1130/G25141A.1
      • Garcia-Castellanos D, Villaseñor A (2011). Messinian salinity crisis regulated by competing tectonics and erosion at the Gibraltar arc. Nature, 480 (7377), 359-63 PMID: 22170684

      2011-02-27

      Ancient abrupt drought at 17ka leads to question: How severe can climate change become?

      Ancient catastrophic drought leads to question: How severe can climate change become?: "How severe can climate change become in a warming world? Worse than anything we've seen in written history, according to results of a study appearing this week in the journal Science."