Showing posts with label science. Show all posts

2016-10-04

Tomanowos - the rock that went through cosmic billiard, megafloods, and idiocy

Present display of the meteorite at the AMNH museum in NY. My photo.
Last week I visited again the rock with the most fascinating story on Earth: 
Tomanowos, meaning the visitor from the sky in the extinct Clackamas language, also known as the Willamette meteorite. 
Supernovas spread throughout space the
iron produced in heavy stars. This ejected iron
ends up in particle nebulas that eventually form
new stars and protoplanets. [Image: NASA] 

When European Americans found it near the Willamette River (Portland, OR) more than a century ago, Tomanowos inevitably went through one of the most hilarious and silly geological stories that I know of, surely driven by the fatal attraction that a rare rock like this exerts on humans. But before going into that let me tell a few things about its origins.

Tomanowos is a rare 15 ton meteorite made of iron and nickel (Fe 91%, Ni 7.6%). As in other metal meteorites, these Fe and Ni atoms formed at the core of stars that shattered the space with the products of nuclear fusion when ending their lives in supernovae explosions. These elements ended up in the nebula that clumped together as protoplanets in our Solar System, and Tomanowos was part of the core of one of these protoplanets, where the heavier metals accumulate. 

Vesta, a surviving protoplanet of the 
early Solar System. Due to their large
 size, protoplanets develop a differenciated 
density distribution with heavier elements like 
iron concentrated in the core. Tomanowos is an 
ejected piece of a protoplanet core like this. 
[EPFL/Jamani Caillet, Harold Clenet]
We also know that later on, about 4 billion years ago, a collision between two of those protoplanets sent our museum piece back to space solitude. Subsequent impacts over billions of years eventually made the orbit of this meteorite cross that of the Earth. As a result of such cosmic billiard, the meteorite entered our atmosphere at a speed of ~60,000 km/h nearly 20,000 years ago and landed on an ice cap in Canada.

Over the following decades, the ice flow slowly transported Tomanowos southwards, towards a glacier lobe that was at the time blocking the Fork River in Montana (USA). The glacial tongue piled ice across the river valley forming a 600-m-high ice-dam that impounded the enormous Lake Missoula. Following the ice flow, Tomanowos happened to reach the dam on the precise year when it collapsed, releasing one of the largest floods ever documented: the #MissoulaFloods that shaped the Scablands in Washington. This process is known as glacial outburst flooding and it still happens every few years in the Perito Moreno glaciar, for example. Except that the water discharge during the Missoula Floods reached the equivalent to a few thousand Niagara Falls. The research of the Missoula floods by Bretz and Pardee in the early 20th century led to one of the most significant paradigm shifts in recent geoscience: the recognition that catastrophic events can significantly contribute to the evolution of  landscape.
Map of the Missoula Floods path, showing Lake Missoula 
(blue), the ice cap where Tomanowos landed (north of the 
lake outlet), and the inundated areas of Washington and 
Oregon (grey).
Source: Washington Univ.

Trapped in ice and rafted down by the flood, Tomanowos crossed Idaho, Washington and Oregon along the overflown Columbia River at speeds sometimes faster than 20 meters per second. While floating up on the flood waters near today's Portland, the ice case broke apart and the meteorite sunk in the flooding waters. Hundreds of other ice-rafted erratics (rocks that do not match the local geology, nor could be transported by rivers or glaciers) have been found along the Columbia River. All are souvenirs from the Missoula floods, but none as rare as Tomanowos.

As the flood ceased, the sunk meteorite became exposed to the atmosphere. Over thousands of years, rain mixed with the iron sulfide inclusions producing sulfuric acid that gradually dissolved the iron of the exposed side of the rock:
These cavities were produced by acid dissolution of iron at the exposed side.
A few thousand years after the flood, the Clackamas arrived to Oregon and named the meteorite as the Visitor of the Sky, a heaven's representative that unified earth, water & sky. Apparently they knew that nickel rocks come from heaven. Were they intrigued by the absence of a crater at the Meteorite site? In any case, the name reminds us that pre-scientific cultures were not idiotic, or not more than us today anyway.

To confirm this latter hypothesis, in 1902 a colonist named Ellis Hughes decided to secretly move the iron rock to his own land and then claim property. Millennia of peaceful rest in the Willamette valley had to come to an end. But because moving a 15-ton rock a distance of 1,200 m without being noticed is not easy, not even in Oregon, Hughes and his son labored for three back-breaking months in secrecy: 

As D. J. Preston hilariously explains, after finally
succeeding with the moving, Hughes built a shack around
the meteorite, announced he had found it on his property
and started charging twenty-five cents admission to view
the heavenly visitor.
It was during this transport that the rock sadly underwent severe mutilations.
Unimpressed by this deployment of idiocy, Hughes' neighbor fabricated a lawsuit contending that the meteorite had, in fact, landed on HIS property. And to buttress his case he showed investigators a huge crater on his land. The case was dismissed when a third neighbor reported a great deal of blasting only the week before the trial.

Ironically, the legitimate owner of the original land of the iron rock turned out to be the Oregon Iron and Steel Company, so far unaware of the meteorite but promptly hiring a twenty-four-hour guard who sat on top of it with a loaded gun while the case was being appealed. They won the case in 1905, selling Tomanowos to the AMNH museum in New York a year later.
Tomanowos in the early 1900s, before being transported to the AMNH.

Today, amazingly enough, the AMNH exhibition does not even mention the Missoula Floods as a key part of Tomanowos' story, in spite of the wide scientific consensus. Same as the meteorite, the Clackamas were also reallocated to a reservation. Their descendants do keep the right to visit Tomanowos in NY and talk to the visitor who brought the Sky, the Water, and the Earth together.

2015-03-26

Microblogs will not become a source of scientific knowledge

This is the contribution I submitted to the newly created Journal of Brief Ideas, which defines itself as a research journal exclusively for articles of 200 words or less: 
Title: Microblogs will not become a source of scientific knowledge
The hypothesis that scientific knowledge can grow out of clearly-written ideas capsuled in 200 words with no antecedents, no references, no methods, and no results, is contradictory with the notion of science itself and therefore does not need to be refuted. However, the profusion of microblogging social networks that may be tempted to introduce DOI's as a way to make their tweets and posts citable, threatens to blur the boundaries with other sources of knowledge. Here, I expose the following brief ideas: 1) that any useful contribution to discern ideas that work from ideas that don't, will need, also in the future, enough words to describe how those ideas were tested; 2) that the routine activity of both scientists and non-scientists will tend to keep discerning the systematic, reproducible studies from bar conversations, online forums, and magically-revealed knowledge; and 3) that consequently the present brief, unreferenced publication will get no credit, even if it turns out to be the first to correctly predict the fail of short unreferenced notes as a source of scientific knowledge. And yet, my last 20 available words call for further transgressive ideas for this field, scientific publishing, that will be hardly recognisable in a decade.

Sadly enough, the editors have not accepted this 'article' for their 'beta journal', on the basis of a lack of a scientific advance in the field:
And I fully agree with their point. All they will attract is ideas, hypotheses, opinions; Scientific advance is much more than that and it will not be achieved in the format proposed. And to be consistent, the Journal of Brief Ideas should either ban most of the contributions they receive (like this) or stop calling itself a scientific journal. It is the reputation of the scientific method (slippery as this can be) that is at risk.

2015-01-14

Scientist evaluation, citations, and the #PaperBubble

[A bit of self-criticism on the science evaluation system, just to start the year.]

Wicked rules can pervert a community.
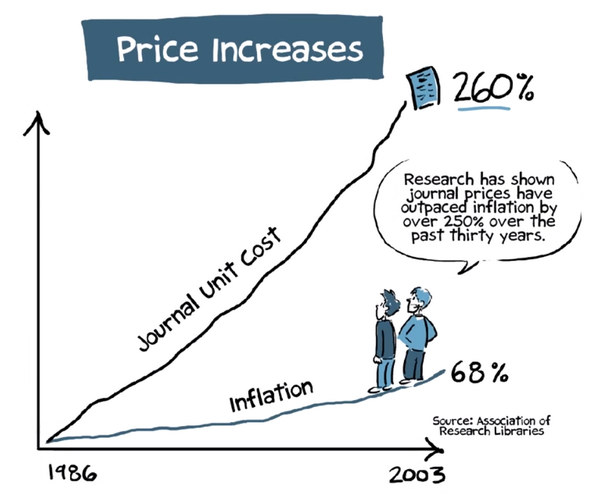
In science, the pioneer wicked rule was evaluating scientists for how much we published, how many papers we coauthored regardless of our real contribution to them, and in what journals do we publish, as a proxy for quality or merit. If you coauthor many articles in good (very cited) journals then you must be a good scientist, that was the institutional mantra. The basic underlaying assumption was that the citations to someone's work by other scientists are a good measure of the importance of her/his research, and I will not question this here. But in this century, to measure the importance of someone's work, we don't need impact factors anymore and we don't need to care about what journal hosts the article in question, because individual citations to each individual article are accessible in a few clicks.
Evaluating by the “mere number of a researcher’s publications” disincentivized risky and potentially-ground-breaking research lacking a short-term publication outcome, as the editor of Science argues. But this is what was being done. And as a result, the scientific articles published every year have nearly tripled since 1990.
Cumulative number of papers
published in Biomedicine
(source: PubMed via this)

The same has happened in most countries and in most disciplines, although some have moved much faster than the average, look :-)
Annual number of papers in Yoga studies over time.

Does this mean that our science is now three times better? Does it mean that our understanding of Nature grows 3 times faster than 25 years ago? 10 times, in the case of Yoga? Mmm. It does mean that now we can only track a small fraction of all the papers that are relevant to our research. 

[By Zhou Tao/Shanghai Daily] 

Needless to say, this has yet another additional price for all of us:

To compensate for the perversion inherent to this article-count approach, evaluators started weighting that number with something called Journal Impact Factor, assuming that articles published in highly cited journals have a higher, statistically-sound chance to have an impact. Perfect plot for a self-accomplishing prophecy; The warnings against this practice are a clamor.


Then citation databases went online and another wicked parameter came on the scene:
h, the Hirsch index, was adopted in the last decade to come over the number of publications criterion. It has now become a commonplace in the evaluation of proposals. But h keeps overvaluing multi-authored papers beyond reason, because it disregards the number of authors and their relative contribution (in most research areas, the relative scientific contribution of the authors of a paper can be approximated in first approach by the position in the author list). The citations to an article of yours count equally if you are the 1st author or the 100th. Therefore, a paper with 100 authors has 100 times more impact on the evaluation system that a single-authored paper. And I'm not being rhetorical here. Please, meet two of the highest-h scientists in Spain (just an example):
Profile 1: 61k citations, 137 papers in 2013 only, h=112.
Profile 2: 117k citations, 164 papers in 2013 only, h=75.
I leave it to you finding the flaw.

Say you are part of a group of 100 friends, each leading his/her own paper and incorporating the other 99 as coauthors. Each citation to any of those 100 papers will reward 100 more people than citing a lonely author. Imagine now that each of them cites each other's paper. They immediately obtain 100 citations per paper. Not bad. It may seem this is a problem with self-citation that can be filtered easily, but it goes far beyond that. The 100 will still be rewarded beyond reason even if their citations come from someone else. Imagine that another group of 100 authors cites all your 100 papers as well as the lonely author's paper. This will give 100 citations to the single author but 10,000 citations to all others. Note that, if this were the first articles for all of them, then the single author would now be h=1, while all other have been miraculously promoted to h=100. 

This problem could be easily solved by weighting each author by 1/2^i , where i is the position of each author in the list. Because


, the weight of all papers would be equal in the citation system. For this, the remainder of the series must be given to the last author, which in practice implies that the last 2 authors get the same credit. Definitely, much fairer than giving all authors a weight of one.

But this was not done. Seemingly, decision makers were not interested in implementing anything like that.

Very predictably, the number of authors per paper just rocketed, and former research groups have often become author pools, with the entire group signing every paper published by each of its members. A symptom of this is that few researchers dare to publish on their own today:
Average number of authors per paper during the
last 100 years.
Source: PubMed
% of single-authored papers
over the last century. 


Papers published per year. Source

The left bar indicates the average number of
articles published by authors that stopped
publishing 15 years after their first publication.
The blue bar on the right shows the articles
published in the same timespan but by
researchers that continued publishing after 15
years. The red bar on top indicates the articles of
those same researchers after the 15th year. One
can see that the researchers that continue
publishing are those having a high research
output. It also shows that the research output
before the year break is the portion that
contributes most to the overall values. Source


So the drive to scientific publication is still based on quantity, not quality.


Ask any editor how many of their requests to review a manuscript are refused by peers, and you'll learn that they often end up doing the reviews themselves. Too many papers for such few reviewers/authors. It is unsurprising that you find funny bugs like this in articles that were supposed to have been reviewed.


It is difficult to find objective (quantitative) criteria for quality. And perhaps it is also time to question the trust on objective parameters. Alternatives such as interpreting the subjective impact foreseen for a given research are also risky. But if the citation criterion is to be adopted, then we do not need h-like indexes or journal impact factors. There are better metrics proposed (examples), they just need to be adopted. Metrics accounting for the author order and the number of coauthors.

Under the present rules, young researchers are pressed to publish as much as possible instead of publishing as good as possible, not only perverting the research system but also inflating a huge publication bubble. The warning lights are long on. China has already realized the problem and may be soon taking action. Why not Europe? Will we wait until this bubble bursts?

Wicked rules pervert communities, so let's just adopt better rules. In 10 years the science publishing panorama will be unrecognizable anyway.

Source: Science Mag. 


PD: Interesting discussion in the comment section of this column in last week's Nature.

PD2: Ironically, a journal called Bubble Science just went closed earlier this year.

PD3: A new metric proposed: Author Impact Factor: tracking the individual scientific impact, by Kumar Pan & Fortunato. link

PD4: Key literature: The coupling between devaluation of writing in scientifi c authorship and infl ation of citation indices by Terry Engelder: https://rock.geosociety.org/net/gsatoday/archive/17/7/pdf/i1052-5173-17-7-44.pdf

PD5: A new journal now allows publishing citable articles of less than 200 words with a DOI. What next? Citable tweets?

PD5b: A paper reinventing the trapezoidal rule https://t.co/CANpYZ8GkX published in high-impact journal & has 268 citations pic.twitter.com/ECI04VaoQ3 — ∆ Garcia-Castellanos (@danigeos) January 28, 2016

PD6: A PosOne paper by V. Vavryčuk including some references on this: "Fair ranking of researchers and research teams" https://dx.plos.org/10.1371/journal.pone.0195509.

PD2022: China is now the first country by number of peer review publications as well as by most-cited articles. Thousands of scientists publish a paper every 5 days and the number of such authors has multiplied by 20 over 15 years.

2014-08-18

67P - how much is a comet worth

I've been trying to learn a bit more about comets (call it summer-research) taking the chance of the visit of the ESA Rosetta mission to comet 67P (aka Churyumov–Gerasimenko).

Comets are small bodies of rock and ice thought to form in the outer regions of the solar system at the same time planets were formed, ca. 4.6 billion years ago. An important known unknown about comets is their relative contribution to the accumulation of water in the early Earth. So learning about them is learning about our planet too.

67P is a 4 km-long ice body orbiting around the sun every 6 years, following an elliptical orbit ranging between those of the Earth and Jupiter.
Barcelona and 67P, to scale
The shape of 67P suggests that it might be the result of the accretion of smaller comets. In fact, one thing that surprises many of us who are unfamiliar with comets is their low density. Most of the comet you see in these pictures has been left empty during its formation. 67P is about 10 2.5 times lighter than water: 102 400 kg/m3 (figures updated after Rosetta's approach), implying that it is a very porous body. Is this related to an accretion process?
Image taken on 2014-08-12 from a distance of 103 km. Credit: ESA/Rosetta/NAVCAM

Another curious fact: 67P used to have a perihelion distance of 2.7 AU (1 AU = distance from the Sun to the Earth), but in February 1959 an approach to Jupiter reduced this to only 1.3 AU, where it remains today. Comets are often shifted by the gravity field of planets, but recent events like this remind us that we are not in a static Solar System. The same process can lead to the split of comets in pieces: a beautiful example is given by the comets 42P/Neujmin and 53P/Van Biesbroeck, which appear to be fragments of a parent comet. This is based on computer integration, a reconstruction of their past position, showing that both comets were close to Jupiter in January 1850 and had nearly identical orbits before that. The debris produced by such comet disintegrations is often responsible for meteor showers like the Perseids seen worldwide in middle August.
Approach to a distance of 104 km.
67P rotates once every 12.7 hours.
Credit: 
ESA/Rosetta/NAVCAM

Rosetta's won't be the first mission actually touching down on a comet (check this list of space missions that have approached comets, and see the unsubtle 'landing' of Deep Impact in the animation below). But it is the first mission ever to smoothly land on a comet (Philae lander) and to analyze its surface. And it is the first mission to orbit a comet, something remarkable since the escape velocity of 67P is only 0.5 m/s. It will also be the first mission to land a probe on the surface and, in the words of ESA, Rosetta will be "the first spacecraft to fly alongside a comet as it heads towards the inner Solar System, watching how a frozen comet is transformed by the warmth of the Sun". A lander will sample the composition and structure of the comet nucleus, drilling more than 20 cm into the subsurface for analysis at the onboard laboratory. 

Rosetta has costed the europeans around 1 billion euros (10^9 €) through a consortium of the German Aerospace Research Institute (DLR) with ESA, CNES, and european and american research institutes. The results will provide information on how comets form and also on the early stages of the Solar System. It should contribute to the discussion on where did the terrestrial water form and when did it arrive here. Previous studies have shown that the isotope ratios of hydrogen in other comets is different from that of oceanic water, but it remains unclear that these comets were representative enough of the comet orbits most likely to contribute to our waters. New answers will arrive soon, together with new questions. 

Deep Impact colliding with comet Temple 1 in 2005

2014-03-26

49 Open Challenges in Earth Science - The Known Unknowns

Mapping Ignorance
ResearchBlogging.org
What keeps Earth scientists busy? These 49 open scientific questions aim at providing an updated, fully-referenced account of the main current scientific questions, disputes, and challenges in Geoscience.


[updated version in this link]


The Early Earth and the Solar System

Advances such as those occurred in the geochemistry of meteorites lead to new exciting hypotheses about the early stages of our planet, but as usual, answers are outnumbered by the new knowledge gaps: 
  1. How did the Earth and other planets form? Were planets formed in situ? Or are orbital changes relatively frequent? What determined the different deep layering of the solar planets? [McKinnon, 2012, Science on Mercury] 
  2. Was there ever a collision of the Earth with another planet Theia, giving birth to our satellite? [Canup, 2013, Science] There is compelling evidence, such as measures of a shorter duration of the Earth's rotation and lunar month in the past, pointing to a Moon much closer to Earth during the early stages of the Solar System. [Williams, CSPG Spec. Pubs., 1991]
  3. What is the long-term heat balance of Earth? How did its internal temperature decay since it formed by accretion of chondrites? How abundant are radiogenic elements in the interior? Did a "faint young sun" ever warm a "snowball Earth"? [Wired; Marty et al., 2013, Science]
  4. What made plate tectonics a dominant process only on Earth? [outreach paper] How did the planet cool down before plate tectonics?[Moore & Webb, 2013, Nature] Was the Earth's crust formed during the early stages of its evolution or is it the result of a gradual distillation of the mantle that continues today along with crustal recycling? Is the crust still growing or does its recycling compensate for crust formation at mid-ocean ridges and other volcanic areas?
  5. How inherent to planetary evolution is the development of life conditions? [Zimmer, 2005, Science, Elkins-Tanton, 2013, Nature] Earth-like planets are now known to be abundant in our galaxy (two out of three stars may have one [e.g., Cassan et al., 2012, Nature]), but how many of them develop widespread durable water chemistry? How much of our water supplied by comets or asteroids? When and how did it reach the Earth? [outreach article]

Earth’s Interior

Our rock-sampling reach is limited to the upper 12 km of the Earth's crust, but the keys to extend our knowledge often lay far deeper than that. Indirect measurements such as seismic wave tomography, together with geodynamic and petrological modeling, become crucial: 
  1. What are the chemical composition and mechanical properties of rocks in the Earth’s mantle at the extreme pressure and temperature they undergo? As planets age and cool off, their internal and surface processes coevolve, chemically and mechanically, shaping also the atmospheric composition. Therefore this question has direct implications for our understanding of the environmental evolution of the Earth. [Kerr, 2005, Science]
  2. What are the dynamic processes in the Earth interior that accommodate and fuel plate tectonics? As seismometers spread more evenly over the planet's surface, the seismic imaging of the interior will rapidly improve, providing a detailed distribution of seismic wave velocity. Simultaneously, lab-based mineral physics must better constrain what these mechanical wave velocities tell us about the hot, deep rocks of uncertain composition in the mantle. Only then will computer models be able to test the proposed geodynamic models by trying to fit quantitatively those data and other geophysical observations such as gravity variations. [ref.3]
  3. Sedimentary and volcanic rocks have recorded changes of the magnetic field throughout the evolution of the Earth. What causes the sudden reversals of the paleomagnetic field? How does the geomagnetic field link to the iron convection properties at the deep Earth? Or inversely, what can we learn about the mechanical behavior of the materials at those depths from the geomagnetic field? [more context in Nature] Are the magnetic reversals too fast to be related to core dynamics? [example.1] [ex.2] [ex.3] Could their frequency be related to the distribution of tectonic plates? [GRL article]. What causes superchrons (periods longer than 10 Myr without magnetic reversals)? Something internal to the core, or induced externally by the mantle/subducting slabs? Was the geomagnetic field always dipolar, or was it more asymmetric in the past? [introduction]
  4. Are intraplate hotspots really made by deep sources of uprising materials (mantle plumes) coming from the deepest Earth's mantle? Or can they be explained by shallower convection? [e.g., Morgan, 1971; see also this recent Geology paper on Yellowstone].
  5. What is the history of and what controls the excursions of the rotation pole relative to the surface geography, known as true polar wander? [ex]
  6. What are the properties of deep rocks? How can we translate the heterogeneity in density, seismic wave velocity, or electromagnetic resistivity presently observed in the mantle and the lithosphere into variations of the mineralogical composition? And how do these measures relate to the dynamics of the Earth and to key mechanical properties such as the viscosity? [Faccenna & Becker, 210, Nature]. 
  7. What are the causes for Large Igneous Provinces and massive flood basalts such as the Columbia River Basalts?

Tectonic-plate motion and deformation 

The successful adoption of the plate tectonics paradigm has lead to a myriad of new questions about its limits and about the lessons for risk mitigation.
Velocity of the earth's surface at the Indian-Asian collision,
from GPS data. Blue star indicates the 2008 China earthquake.
Source: CALTECH
  1. What is the relative importance of the forces driving plate tectonics: slab pull, slab suction, mantle drag, and ridge push? [e.g., Conrad & Lithgow-Bertelloni, 2004; Negredo et al., GRL, 2004, vs. van Benthem & Govers, JGR, 2010]. What is the force balance and the geochemical cycle in subduction zones? [Emry et al., 2014, JGR] How much water (and how deep) penetrates into the mantle? [Ranero et al., 2003, Nature] How much subcontinental erosion takes place under subduction areas? [Ranero et al., 2000, Nature]
  2. What happens after the collision of two continents? Does continental collision diminish the rate of plate subduction, as suggested by the slab-pull paradigm? [Alvarez, EPSL, 2010] How frequent are the processes of mantle delamination and slab break-off? What determines their occurrence? [Magni et al., GRL, 2013; Durezt & Gerya, Tectonoph., 2013]
  3. Why are orogens curved when seen from space? [Weil & Sussman, 2004, GSASP 383]
  4. How does the long-term deformation derived from paleomagnetism and structural geology link quantitatively to the present-day motions derived from GPS and from neotectonic patterns of crustal deformation? [Calais et al., EPSL, 2003] How do these last two relate to each other? [ref] Can we learn from regional structure of the crust/lithosphere from that link (or viceversa)? 
  5. Are plate interiors moving in steady-state linear motion? How rigid are these and why/when did they deform? [Davis et al., (2005) doi:10.1038/nature04781, and Wernicke & Davis, (2010) doi:10.1785/gssrl.81.5.694]. 
  6. How is the relative motion between continents accommodated in diffuse plate boundaries? (eg., the Iberian/African plate boundary). What determines the (a)seismicity of a plate contact? 
  7. How/when does deformation propagate from the plate boundaries into plate interiors? [e.g., Cloetingh et al., 2005, QSR] 
  8. What is the rheological stratification of the lithosphere: like a jelly sandwich? Or rather like a creme brulée? [Burov & Watts, 2006]. Is the lower crust ductile? Is strength concentrated at the uppermost mantle? Or just the other way around? [e.g., McKenzie et al., 2000, JGR; Jackson, 2002, GSA Today; Handy & Brun, 2004; and a nice recent post]. 
  9. Add caption
      Does the climate-controlled erosion and surface transport of sediment modify the patterns of tectonic deformation? Does vigorous erosion cause localized deformation in the core of mountain belts and prevent the propagation of tectonic shortening into the undeformed forelands? Does the deposition of sediment on the flank of mountains stop the frontal advance of the orogen? Is there any field evidence for these effects predicted from computer models? [Philip Allen's blog] [Willett, 1999, JGR; Whipple, 2009; Garcia-Castellanos, EPSL, 2007]
    1. Can earthquakes be predicted? [Heki, 2011, GRL; Freed, 2012, Nat.Geosc.]. How far away can they be mechanically triggered? [Tibi et al., 2003, Nature]. Little is known about how faults form and when do they reactivate [ex.6], and even worse, there seems to be no clear pathway as to solve this problem in the near future. Unexpected breakthroughs needed. 
    2. How can the prediction of volcanic eruptions be improved? What determines the rates of magma accumulation in the chamber and what mechanisms make magmas eruptible? [ex.7][ex.7b]
    3. In many regions, the elevation of the continents does not match the predictions from the classical principle of isostasy for the Earth's outer rigid layer (the lithosphere). This deviation is known as dynamic topography, by opposition to isostatic topography. But what are the mechanisms responsible? Can we learn about the mantle dynamics by estimating dynamic topography? [ref.1] Can the hidden loads needed to explain the accumulation of sediment next to orogens (foreland basins) be linked to these dynamic forces? [Busby & Azor, 2012, Wiley]
    4. How do land-forming processes react to climate change at a variety of scales, ranging from the Milankovitch cycles to the late Cenozoic cooling of the Earth? Is there a feedback from erosion into climate at these time scales, through the Carbon cycle and the weathering of silicates, for example? What is the role of the surface uplift and erosion of Tibet on the drawdown of atmospheric CO2 over the Cenozoic? [Garzione, 2008, Geology]

    Earth's landscape history and present environment

    The shape of the planet's solid surface, its topography, is the key feature that connects many of the disciplines within Earth science, probably because it is the feature that most affects our daily life. It is today common wisdom that landscape forms from a complex interplay between tectonics and climate, through a list of mechanical, chemical, and biological processes acting at the surface of the Solid Earth. Topographic data is becoming now available at resolutions finer than a few meters, and the sedimentary record is also being archived at unprecedented rates. But:
    Drainage patterns in Yarlung Tsangpo River, China (NASA)

    1. Can we use these data to derive past tectonic and climatic conditions? Will we ever know enough about the erosion and transport processes? Was also the stocasticity of meteorological and tectonic events relevant in the resulting landscape? And how much has life contributed to shape the Earth's surface? 
    2. Can classical geomorphological concepts such as 'peneplanation' or 'retrogressive erosion' be understood quantitatively? Old mountain ranges such as the Appalachian or the Urals seem to retain relief for > 10^8 years, while fluvial valleys under the Antarctica are preserved under moving ice of kilometric thickness since the Neogene. What controls the time-scale of topographic decay? [Egholm, 2013, Nature]
    3. What are the erosion and transport laws governing the evolution of the Earth’s Surface?[Willenbring et al., Geology, 2013] Rivers transport sediment particles that are at the same time the tools for erosion but also the shield protecting the bedrock. How important is this double role of sediment for the evolution of landscapes? [Sklar & Dietrich, Geology, 2001 (tools and cover effect); Cowie et al., Geology, 2008 (a field example)].
    4. Can we predict sediment production and transport for hazard and scientific purposes? [NAS SP report, 2010; Geology, 2013] 
    5. Smaller-scale patterns at the limit
      between river channels and hillslopes.
      Credit: Perron Group, MIT
    6. What do the preserved 4D patterns of sediment flow tell us from the past of the Earth? Is it possible to quantitatively link past climatic and tectonic records to the present landforms? Is it possible to separate the signals of both processes? [e.g., Armitage et al., 2011, Nature Geosc]. 
    7. Can we differentiate changes in the tectonic and climate regimes as recorded in sediment stratigraphy? Some think both signals are indeed distinguishable [Armitage et al., 2011, Nat.Geo.]. Others (Jerolmack & Paola, 2010, GRL], argue that the dynamics intrinsic to the sediment transport system can be 'noisy' enough to drown out any signal of an external forcing. 
    8. Does surface erosion draw hot rock towards the Earth’s surface? Do tectonic folds grow preferentially where rivers cut down through them, causing them to look like up-turned boats with a deep transverse incision? [Simpson, 2004, Geology]
    9. How resilient is the ocean to chemical perturbations? What caused the huge salt deposition in the Mediterranean known as the Messinian Salinity Crisis? Was the Mediterranean truly desiccated? What were the effects on climate and biology, and what can we learn from extreme salt giants like this? [e.g., Hsu, 1983; Clauzon et al., Geology, 1996; Krijgsman et al, 1999, Nature; Garcia-Castellanos & Villaseñor, Nature, 2011]. Were the normal marine conditions truly reestablished by the largest flood documented on Earth, 5.3 million years ago? [Garcia-Castellanos et al., 2009, Nature]
      Artistic view of the refilll of the
      Mediterranean after the Messinian salinity
      crisis. Authors: Pibernat & Garcia-Castellanos.
      Downloadable here.
    10. How do the patterns of river networks form? [eg. Devauchelle et al., 2012, PNAS; Perron et al., 2012, Nature]. And what information about the past do these patterns contain? Can we quantitatively reconstruct past ecology or climate from old river patterns? [e.g., Hartley et al., 2010, J. Sedim. Res.]
    11. Do we need a new geological epoch called Anthropocene? When do the Homo Sapiens start to have a significant impact on the Earth System? 8000 BP?[Ruddiman, 2003, Climatic Change]; 2000 BP? [Scalenghe, 2011, The Holocene]; 1850 AD? [Crutzen & Steffen, 2003]

    Climate, Life, and Earth

    Source: R.E..Rhode, Wikipedia
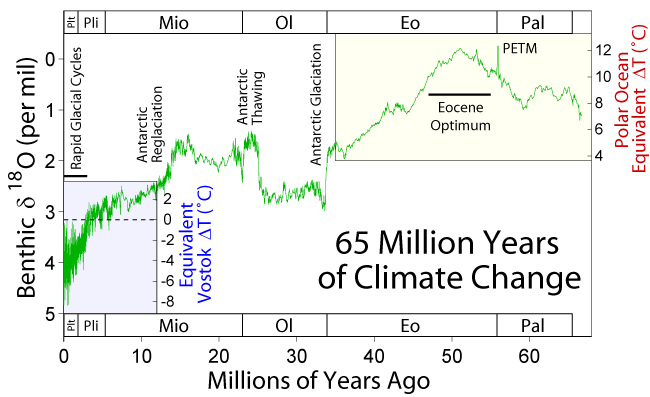
    The geological record shows that climate is relatively stable over tectonic time-scales whereas it undergoes abrupt changes in periods ranging from decades to hundreds of thousand years. Past periods when the planet underwent extreme climate conditions may help to understand the mechanisms behind that behavior and its significance for the evolution of the Solid Earth.

    1. What caused the largest carbon isotope changes in Earth? [Grotzinger et al., 2011, Nat. Geosc.] How does Earth’s climate system respond to elevated levels of atmospheric CO2? 
    2. Was there ever a snow-ball Earth during the earliest stages of Life on Earth? 
    3. Were there also rivers and lakes on Mars? [Hans, 2012] Were there large outburst floods similar to those on Earth? 
    4. What were the causes and what shaped the recovery from mass extinctions as those at the K-T boundary, the Permian-Triassic or the Late Triassic? Massive volcanism? Meteorites? Microbes? [recent papers: ex.8, ex.9, ex.10, Rothman et al., 2014, PNAS]
    5. What triggered the extreme climatic variability during the Quaternary and the roughly coeval acceleration in continental erosion and sediment delivery to the margins? [Peizhen, Molnar et al., 2001, Nature; Herman et al., 2013, Nature] Was this related to the tectonic closure of the Central American Seaway? How do these climate events translate quantitatively into sea level changes?
    6. How do climate changes translate quantitatively into sea level changes? How do ice sheets and sea level respond to a warming climate? What controls regional patterns of precipitation, such as those associated with monsoons or El Niño?
    7. What caused the Quaternary extinction(s)? Human expansion? Climate Change? How sensitive are ecosystems and biodiversity to environmental change? Was the large fauna extinction ~13,000 yr ago a result of the Younger Dryas climatic event? Was this caused by an extraterrestrial impact? [ex.11, ex.12] Or may it be linked to the outburst of Lake Agassiz? 
    8. How relevant are subsurface microorganisms to earth dynamics by controlling soil formation and the methane cycle? What are the origin, composition, and global significance of deep subseafloor communities? What are the limits of life in the subseafloor realm?  
    9. The atmosphere is shaped by the presence of life, a powerful chemical force. The Earth’s evolution has seems to affect the evolution of life [see the Cambrian explosion of animal life, for instance; plus this recent paper on that]. To what extent? And how much control has life on climate? [another recent one]. Is it possible to quantify these links to make reliable predictions that allow filling the data gaps or assessing the chances for extraterrestrial life?
    10. How much of the present climate change is anthropogenic? How will growing emissions from a growing global population with a growing consumption impact on climate? 

    Broader open questions


    1. Many of the questions above are related to the extreme diversity of spatial scales of Earth processes. Direct observation (by sampling or remotely) is mostly limited to a thin layer around the solid surface of the Earth, and physical experimentation is limited to the pressures of the uppermost layers of the planet. Many processes including plate tectonics are known to be driven by the nature of the materials that make up the planet interiors, down to the smallest atomic scales, as thought for instance for the trigger of earthquakes. Answers may arrive via new devices and analytical tools working at the high pressures and temperatures of Earth’s interior.
    2. Time scales also pose a problem to know the mechanical and chemical properties of Earth's materials. Partly because we deal with time scales in very different orders of magnitude while we are limited to make observations from the present. But also because scaling the rates of lab experiments (e.g., mineral physics) or analogue models (e.g., sandbox experiments) with the corresponding geological scenarios is not always convincing. 
    3. Implementing Episodicity in Gradualism: For historical reasons, geology has generally underestimated the role of episodicity in nature. However, there is a growing view that exceptional events and stochasticity have a relevant role in many of Earth's subsystems. An example for this is the preeminence of flooding events (larger than average) in erosion and surface sediment transport and during the evolution of landscape, and the importance of upscaling flood stochasticity into sediment transport models [eg., Lague, 2010, JGR]. Climate variability at all time-scales has been already mentioned above. Even plate tectonics may have been episodic (during the Archean at least, [ref]).  4D hyperscale data sets in geomorphology are increasingly showing the limits of smooth-process approaches. Future understanding of the Earth will benefit from incorporating the full frequency spectrum (the episodicity) in modeling natural phenomena, rather than systematically approaching these as gradual processes. 
    4. Computer models tell whether the complexity of nature can be explained by the interplay between simple processes, but: how can we further model the Earth as a complex system of complex systems? And when can we expect ‘compact’ explanations? 

    General background:
      Note that the specific references given above for each open question are sometimes just examples and may not always be the best representative. Furthermore, the list is surely biased towards Solid Earth Science, my own field. The following general references can give you an alternative perspective on the subject.
      Please send additions/suggestions to d.g.c@csic.es

      Acknowledgements:
      For various inputs/criticisms to this list: Brian Romans, Umberto Lombardo, Jean Braun, Mikael Attal, Alexandra Witze, Michael Klaas, Matt Hall, Chris Rowan.
      PD: I published a shorter version of this post in Mapping Ignorance. -Daniel

      2013-11-27

      How old is Earth Science?

      Many geoscientists think of their field as not much older than Lyell or Hutton; as a science that bloomed sometime during the eighteenth century. Nevertheless, the term geology was first used by Ulisse Aldrovandi in 1603 (Vai and Cavazza, 2003) and introduced as a regular term by Horace de Saussure in 1779. The danish scholar Nicolas Steno (1638-1686) set the bases for stratigraphy: the law of superposition and the principle of original horizontality.

      But the roots of the scientific interest for the history of the Earth are even deeper than that.

      Ortelius' world map, inspiring his own anticipation of
      continental drift
      In 1596 Abraham Ortelius, a flemish geographer serving the Spanish crown, wrote: "America (...) was (...) torn away from Europe and Africa, by earthquakes and flood" "the vestiges of the rupture reveal themselves: if someone brings forward a map of the world and considers carefully the coasts of the three aforementioned parts of the earth, where they face each other". This quotation extraordinarily anticipated by more than three centuries the theory of continental drift, but it remained forgotten and was rediscovered only in 1994.
      Ortelius' idea was in turn a direct result of the vast exploration discoveries that took place in the previous decades. In the words of Alvarez & Leitao (2012, Geology): "The Iberian Voyages of Discovery of the fifteenth and sixteenth centuries marked a major advance in the understanding of the Earth—the greatest advance since antiquity, and comparable in scope and importance with the Geological Revolution, the Darwinian Revolution, and the Plate Tectonic Revolution, and we encourage geologists and other Earth scientists to embrace the Voyages as part of our geological scientific heritage."
      This Edmund Halley’s map of geomagnetic declination (~1700 
      AD) came about two centuries later than similar studies by 
      Portuguese explorers, who used these magnetic anomalies for the 
      long-lived challenge of determining longitude during navigation.

      The practical drive behind those first geoscientific questions? In the 16th century, "the Portuguese began to make systematic surveys of magnetic declination by comparing the direction of a compass needle with the line of shadow of the Sun at local noon". Magnetic declination could in this way be used to estimate the geographical longitude, a fundamental navigation problem at the time which final solution had to wait for the eighteenth century, when accurate chronometers were first developed. In fact, it turns out that the phenomenon was well known since centuries earlier, and by 1492, Columbus first described the agonal line in the Atlantic Ocean, where the compass points exactly to the geographic pole.

      In 1736, a franco-spanish expedition is set to south America to determine the size and shape of the globe, whether it is flattened or elongated at its poles, a long standing scientific question at the time. The expedition included Charles de La Condamine, Jussieu, Pierre Bouguer, Jorge Juan & Antonio de Ulloa. Several books were published out of these expeditions that had great novelty and impact at the time. Juan & Ulloa's (Relacion historica del viage a la America Meridional hecho de orden de S. Mag. para medir algunos grados de meridiano terrestre y venir por ellos en conocimiento de la verdadera figura y magnitud de la tierra, con otras observaciones astronomicas y phisicas), was published 3 years after La Condamine's but showed far more detail, maps and illustrations.
      Juan & Ulloa's cover, 1748


      In summary, the systematic study of the Earth has a history behind as long as in any other scientific field. Quoting again A&L: geoscientists can "trace their intellectual ancestry back to the Copernican Revolution of the 16th and 17th centuries, just as astronomers and physicists do".

      References:
      • Alvarez & Leitao, 2010, Geology, 38, 231–234, doi: 10.1130/G30602.1
      • Romm, James, Nature 367, 407-408, 1994, A new forerunner for continental drift. doi:10.1038/367407a0
      • G. B. Vai et W. Cavazza, ed, Four centuries of the word 'Geology', Ulisse Aldrovandi 1603 in Bologna, Minerva Edizioni, Bologna, 2003