Showing posts with label erosion. Show all posts

2018-07-07

Megainundaciones: ¿cuánto contribuyen al relieve terrestre?

[Este post fue inicialmente escrito para la revista de divulgación Naukas y está relacionado con dos artículos científicos que hemos publicado recientemente (ver lista de referencias al final)]

Antes de la geología estaba el mito. Catástrofes épicas que explicaban porqué vemos fósiles de seres que no existen y porqué otros fósiles que reconocemos como seres marinos se encuentran en lo alto de las montañas. Esa visión catastrofista tenía respuesta para todo y se convirtió en parte fundamental de las religiones.

Pero cuando la revolución copernicana emergió del renacimiento, esa forma mágica y sobrenatural de entender el mundo dejó de bastar y surgió la necesidad de comprender en base a lo cotidiano, a lo empírico, con un alcance universal.
Nicolas Steno desarrolló en 1669 los principios de la estratigrafía y un siglo después, el concepto trending de la época, el uniformismo, fue incorporado a la geología bajo el nombre de gradualismo (Hutton, 1785). Postulaba que las rocas y sus fósiles han sido formadas por los mismos procesos que observamos hoy en día, actuando lentamente, a velocidades similares a las actuales y durante  larguísimos periodos de tiempo que desafiaban los dogmas religiosos.

Así pues, desde los orígenes de la geología como una ciencia moderna más, el relieve de la Tierra ha sido visto como el resultado de lentos procesos: la erosión de los ríos; el movimiento y la deformación de los continentes. La ciencia geológica se fraguó por tanto en contraposición con aquella visión religiosa de grandes cataclismos. El gradualismo se convirtió en uno de sus más sólidos mantras científicos.

Y todo fue muy bien durante 150 años hasta que, a principios del siglo pasado, un hombre se atrevió a blasfemar contra ese paradigma tan lentamente consolidado. Se llamaba J. Harlen Bretz.
J. Harlen Bretz, 1949.

Bretz estudió el paisaje de la región de los Scablands, que ocupan buena parte del estado de Washington (EEUU). Encontró formas erosivas y acumulaciones de sedimento que sólo podía explicar invocando megainundaciones de una magnitud sin precedentes, hoy bien conocidas como las Inundaciones de Missoula. Inundaciones descomunales ocurridas hace unos 17.000 años y que debían haber excedido en varios órdenes de magnitud las inundaciones que habitualmente, en base a nuestra corta experiencia histórica, consideramos catastróficas.

Pese a su conocido carácter terco, Bretz tardó cuatro décadas en convencer a la comunidad geomorfológica de que su interpretación, por excéntrica que pareciera, era la más sencilla. Se estaba enfrentando a siglos de lucha entre las concepciones geológica y religiosa del mundo, y muchos de sus colegas le consideraban un lunático defensor de la segunda. A su manera, Bretz se convirtió en un hereje de la ciencia.

Todavía hoy en día, la noción de que las inundaciones más excepcionales también contribuyen al modelado del paisaje sigue siendo vastamente ignorada.

Pero ¿cuáles son estos fenómenos? ¿Cuanto contribuyen? ¿Cómo de excepcionales son?


Uno de los mecanismos responsables de estas megainundaciones es el desbordamiento de grandes lagos. El fenómeno es idéntico al que ocurre cuando una avalancha de roca bloquea el valle de un río de montaña y forma un nuevo lago: Cuando el lago rebosa, aunque inicialmente lo haga muy lentamente, la erosión puede desencadenar un aumento exponencial del flujo de agua, hasta producir caudales enormes de agua que pueden causar importantes pérdidas humanas y económicas río abajo.

Para emular el proceso, en este experimento en el USGS de Oregón formamos un pequeño lago tras una barrera de arena compactada:
Experimento de desbordamiento de un lago 
de 23 m2 barrado por arena compactada.

La erosión que produce el agua en el canal de salida se retroalimenta con el flujo de agua que dicho canal permite evacuar:


Esquema de la retroalimentación entre flujo de agua y erosión del 
desaguadero de un lago de montaña. Cuanta más erosión, más caudal 
de agua. Cuanto más caudal, más rápida la erosión.


Los datos disponibles sobre el pico de caudal que se alcanza en desbordamientos históricos permiten estimar empíricamente el riesgo en escenarios naturales. Los resultados son bastante intuitivos: cuanto mayor es el tamaño del lago y más débil es la barrera, más intenso será el pico de descarga de agua tras el desbordamiento. Pero estos resultados apenas permiten predecir la intensidad de las inundaciones porque las heterogeneidades de la barrera pueden ser tan determinantes como los factores anteriores: Una sola roca de gran tamaño, por ejemplo, puede retrasar la erosión del desaguadero y evitar la inundación.
Este sigue siendo el video que mejor muestra 
la fuerza a la que puede conducir un desbordamiento 
(en este caso el mar desborda sobre una mina a cielo 
abierto). Se trata de la Pantai Remis landslide
que ocurrió en Malasia en 1993.

Time-lapse del desbordamiento de una presa de tierra 
en Oregón (Marmot Dam, Sandy River, Oregon)

Sin embargo, las inundaciones por desbordamiento han sido mucho mayores en el pasado geológico que esos casos históricos, y pese a ello han permanecido mayormente ignoradas.

En un  artículo reciente (la referencia está al final de este post, Abril et al., 2018) hemos modelizado en 3D el flujo de la mayor megainundación de entre las mejor documentadas: El desbordamiento del Lago Bonneville durante el Pleistoceno, hace unos 15.000 años:


El desbordamiento del Lago Bonneville (Jarrett & Malde, 1987) tuvo lugar al sobrepasar su nivel la barrera topográfica formada por un delta fluvial (sedimento consolidado) a unos 1500 m sobre el nivel del mar. Alcanzó un caudal de agua de un millón de metros cúbicos por segundo: el agua que cabe en el Camp Nou, cada 2 segundos. Estos posts dan algo más de contexto: [1][2].

Desde las primeras exploraciones de Gilbert en el Lago Bonneville (Gilbert, 1890) y las de Bretz, se han acumulado numerosas evidencias de que el desbordamiento de muchos otros lagos ha desencadenado inundaciones de mayor intensidad que las registradas históricamente, que alcanzan los 10^5 m3/s (la mitad del débito medio actual del río Amazonas), como ocurrió p.e. tras el bloqueo del río Yigong por una avalancha en 2000.

Sin embargo, la mayor inundación podría haber sido la Inundación Zancliense, que puso fin a la Crisis de Salinidad Messiniense hace 5.3 millones de años (e.g., Blanc, 2006; Garcia-Castellanos et al., 2009), tras el desbordamiento del Océano Atlántico sobre un Mediterráneo parcialmente desecado. El consenso en este caso no es completo, pero de confirmarse podría haber causado caudales de hasta 100 millones de metros cúbicos por segundo. La compilación más completa de este tipo de eventos puede encontrarse en el material suplementario de nuestro artículo (Garcia-Castellanos & O'Connor, 2018, Scientific Reports) referencia más abajo).

Lo que proponemos en ese segundo artículo es un nuevo método para medir la erodabilidad de la superficie de la Tierra, es decir la facilidad con la que ésta es modificada por la acción mecánica del agua. Y ese método utiliza precisamente la erosión producida en todas estas megainundaciones ocurridas en el pasado reciente de la Tierra.

El método consiste en resolver con un código escrito en C un sistema de ecuaciones que calcula la erosión producida por el agua (modelos desarrollados por la comunidad geomorfológica global) y el caudal de agua que se produce en el desaguadero de un lago (relaciones hidrológicas relativamente sencillas). Simulando con este programa el desbordamiento de cada lago buscamos el valor de la erodabilidad de la presa natural correspondiente que permite reproducir los datos del caudal de agua. Estos datos de caudal han sido derivados a lo largo de décadas en numerosos estudios de geomorfología de campo en lagos del Pleistoceno (O'Connor & Beebee, 2009).

Esos estudios previos, junto con experimentos realizados con presas de tierra o arena, nos permiten disponer de datos sobre la descarga de agua y la erosión que se extienden a lo largo de 10 órdenes de magnitud en términos de volumen de agua total evacuada. La figura muestra los escenarios naturales mejor estudiados (los de volúmenes más importantes).

Datos sobre inundaciones debidas al desbordamiento de lagos naturales, compilados por O’Connor & Beebee (2010). Cada punto es una inundación indicando la descarga máxima de agua frente al volumen total de agua del lago. Los datos se extienden a 10 órdenes de magnitud en términos de volumen. 


Estos datos han servido para estimar el riesgo en escenarios naturales, aunque con muy poca precisión, para decidir el desalojo de valles fluviales cuando un río es bloqueado por una avalancha de roca, como ocurrió en el río Hunza (sin consecuencias) o en el desbordamiento e inundación en 1963 del Lago Issyk.

A nosotros, los datos de caudal nos han servido para cuantificar mejor a qué velocidad erosiona el agua el relieve del planeta. La esperanza es que en un futuro seamos capaces de predecir mejor la erosión, y concretamente, la peligrosidad de lagos a punto de ser desbordados.

Resultado de la simulación numérica de dos inundaciones (izquierda:
Lago Bonneville; derecha, experimento del vídeo mostrado más arriba).
Se muestra la evolución de varios parámetros como el caudal de agua Q
o el nivel del agua z_l. La erodabilidad necesitada para reproducir los
datos de caudal (círculos) es mucho menor en el experimento que en
Bonneville.
Relación encontrada entre la erodabilidad del desaguadero 
de los lagos estudiados y el tipo de roca. La correlación 
demuestra que el método permite medir la erodabilidad.

Los resultados indican no sólo que los desbordamientos catastróficos, pese a ser poco frecuentes, pueden cambiar significativamente el relieve, sino que además será importante incluir la periodicidad de las inundaciones (meteorológicas o no) en los futuros modelos, porque su distribución frecuencia-magnitud es también crucial en la evolución del relieve terrestre.

[My conference on this subject at the PAGES meeting, 2017]


Referencias:
  • Garcia-Castellanos, D., J. O’Connor, 2018. Outburst floods provide erodability estimates consistent with long-term landscape evolution. Scientific Reports. 8:10573. Doi:10.1038/s41598-018-28981-y [open access]
  • Abril-Hernández, J.M., Periáñez, R., O'Connor, J.E., Garcia-Castellanos, D. Computational Fluid Dynamics simulations of the Late Pleistocene Lake Bonneville Flood (2018) Journal of Hydrology, 561, pp. 1-15. DOI: 10.1016/j.jhydrol.2018.03.065

Gilbert, Grove Karl, 1890. Lake Bonneville. 438 p., 51 leaves of plates. Monographs of the United States Geological Survey, v. 1.
O’Connor, J.E., 1993, Hydrology, Hydraulics, and Geomorphology of the Bonneville Flood: Geological Society of America Special Paper 274, 83

2016-02-24

Extreme Geodynamics at the Tsangpo Gorge

If you aim at understanding what shapes the surface of the Earth, the Tsangpo Gorge (Eastern syntax of the Himalayas) will inevitably become one of your favorite places.

This is the place where bedrock is
being eroded at the fastest
measured rate of nearly 1 mm/yr.
The uncommonly vertical valley
walls adopt this high angle to cope
by landsliding with the incision rates
produced by water. 
This is the place on Earth where one of the the highest bedrock erosion rates, the fastest tectonic uplift, and some of the highest topographic gradients have been measured. Every year, nearly 1 cm of very hard metamorphic rock is dig by the Tsangpo River, which descends from an elevation of >3000 m near the Tibetan plateau, to a mere 1000 m in less than 100 km. An average water discharge above 1400 m3/s, together with the pronounced slope, implies a huge erosion power.
Upstream from this gorge, there are widespread terraces and shore sediments of a lake that used to cover a few hundred kilometers of the river valley and impounded up to 800 km3 of water in a lake. What caused this impoundment is a matter of discussion: Only the tectonic uplift along the gorge? Or also an increase in landsliding from the valley flanks during the Pleistocene? Or glacial moraine accumulations?
The long duration of this competition between uplift and erosion (at least 10 Myr) implies that the region must be approximately in equilibrium, so uplift rates are presumably in the range of a cm per year, only comparable to the post-glacial isostatic rebound of Scandinavia.


A recent study of the infill of those lake sediments concludes that the steepening of the Tsangpo Gorge started about 2 to 2.5 million years ago as a consequence of a faster rock uplift: 
(A) Longitudinal river profile of the Tsangpo River, location of drill cores with observed depth to bedrock (vertical black bars), estimated depth to bedrock (yellow area), and reconstructed valley bottom before uplift of Tsangpo Gorge (dashed line). (B) Hillslope angles at the river flanks, specific stream power, and landslide erosion rates. (C) Erosion rates of close to 10 mm/yr are reflected in the age at which the minerals cooled down while being exhumed towards the surface. From Wang et al., 2014, Science. 
The extreme uplift and exhumation rates have been linked to a feedback effect of erosion on channelizing crustal rock towards the surface (the so called tectonic aneurysm; Montgomery & Stolar, 2006).

In contrast, other studies favor the role of glacial transport from the high surrounding mountains near the gorge in blocking the river with glacial moraines. This may have triggered megafloods sourced at impoundments formed by glacial dams (Lang et al., 2013, Geology), since some of the largest known outburst floods in the world have also been reported here.

Tsangpo Gorge
Hence, the competition between tectonic uplift and erosion at the Tsangpo encompasses many of the big conundrums in present geomorphology and geodynamics: the importance of episodicity in landscape evolution, the implications of the glacial ages on erosion rates, the possible effects of climate on tectonic deformation...

2015-07-30

Erosion in northern Spain (Ebro Basin)

The previous post dealt with the erosion of the Ebro Basin after its colmatation with sediment, about 10 million years ago. The journal Geology has just chosen the following picture to illustrate the cover of their August volume:

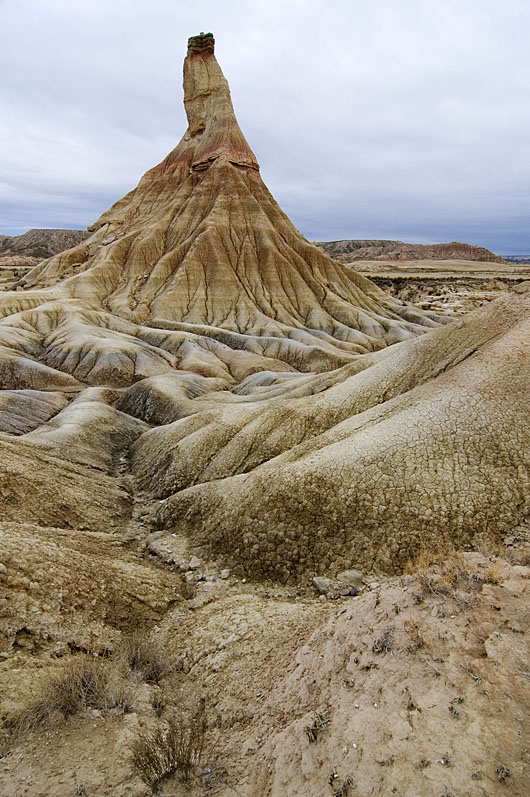
Castildetierra is one of the many hills sculpted by erosion of the ancient
sediment infill of the Ebro Basin at Bardenas Reales (Navarra, Spain). 

Photo: Larrión & Pimoulier.
Location: 42.2103 N, 1.5157 W
The soft alluvial clays that make most of this hill are interbedded with harder lacustrine limestones and fluvial sandstones. The same alternation prevails over much of the Ebro Basin (NE Spain). These strata record a 19-million-year-old lake and alluvial system in the centre of an endorheic Ebro basin (84,000 km2 in area). Subsequent basin capture and drainage integration towards the Mediterranean lead to erosional features like the one in the picture.

Despite the most recent sedimentary has been removed by erosion, our study could date this major drainage change at 12.0-7.5 million years ago, based on isostatic modeling constrained with paleomagnetic data. In these badlands at Bardenas Reales (Navarra), high erosion rates have been measured in the order of millimeters per year, but how these rates link to the long-term history of the region is unclear. Other places in the basin show Pleistocene erosion rates in the order of 0.1-0.4 mm/yr, whereas our results suggest an average erosion rate since the Miocene of 0.05-0.1 mm/yr.


Summary of the scientific article in Geology: Basins formed within mountainous regions often become perfect sedimentary traps that do not drain to the sea but to internal evaporitic lakes. When they do, their sediment layers ideally record the climatic, topographic, and tectonic history of the surroundings. And when these basins eventually overtop or overfill with sediment, they are rapidly excavated by the new outflowing fluvial network, exposing excellent stratigraphic outcrops. However, this erosion often removes the uppermost basin infill, and essential information about the late basin history is lost. We have estimated the timing and elevation of the maximum infill of the Ebro basin (NE Spain) by computing the rebound of the basin in response to erosion, adopting the common idea that the Earth's rigid outer shell (the lithosphere) rests on a fluid magmatic asthenosphere in an Archimedes-type equilibrium (isostasy). We combine these calculations with existing paleomagnetic ages of the sediment basin infill. The results show that the basin became overfilled between 12 and 7.5 million years ago, and that it reached a maximum elevation of up to 750 m above present sea level. The basin has been ever since incised at a rate close to 0.1 mm/yr and has been isostatically uplifted by up to 630 m at its center. This uplift may explain why the Ebro River, opposite to other large Mediterranean rivers, does not present a deep gorge excavated within its own basin during the desiccation of the Mediterranean (Messinian salinity crisis, 5.5 million years ago).


Evolución topográfica de la Cuenca del Ebro

[Este post hace divulgación de un trabajo que acabamos de publicar en Geology
[This is outreach material about our own research, now published in Geology

Viajando entre Navarra y Lleida habrás reparado seguramente en las capas casi horizontales de sedimento, omnipresentes en la Cuenca del Ebro. Se trata de sedimento depositado en el fondo de lagos y en ríos durante el Mioceno (hace entre 24 y 5 millones de años), proveniente de la erosión del Pirineo y, en menor medida, del Sistema Ibérico y la Cordillera Costero-Catalana.

1. Vista desde la cima de San Caprasio (Zaragoza), en el centro de la Cuenca del Ebro (cubierta por las nubes). A la derecha aparecen los sedimentos calcáreos más modernos preservados en la cuenca, datados en 13.6 millones de años. Foto: DGC.
2. Bardenas Reales (Navarra). Foto: PN Bardenas.
Soft alluvial clays interbedded with harder lacustrine limestones and fluvial sandstones predominate over much of the Ebro Basin in NE Spain. In these badlands at Bardenas Reales (Castildetierra, Navarra), high erosion rates have been measured in the order of millimeters per year, but how these rates link to the long-term history of the basin is unclear. These strata record a 15-million-years-old lake and alluvial system in the centre of an endorheic Ebro basin (84,000 km2 in area). Subsequent basin capture and drainage integration towards the Mediterranean lead to erosional features like the one in the picture. Our study dates this major drainage change at 12.0-7.5 million years ago. Location: 42.2103 N, 1.5157 W
3. La roca calcárea en lo alto del
Cabezo de Castildetierra (Bardenas 
Reales, Navarra) apenas protege a 
las margas de la erosión. Esas calizas 
se formaron en los lagos que ocupaban 
la Cuenca del Ebro hace entre 36 y 10 
millones de años. Foto: Carlos Sancho

Ese sedimento contiene importantes cantidades de yeso recristalizado (CaSO4·2H2O, Imagen 4), proveniente de la disolución de yesos más antiguos en el Pirineo. La acumulación de estas rocas evaporíticas indica que ese antiguo sistema de lagos del centro de la cuenca carecía de desaguadero, es decir, era un sistema endorreico en el que todo el agua recogida acababa siendo evaporada.

4. Yeso cristalizado visible en los niveles intermedios de San
Caprasio. Unos 18 millones de años de edad. Foto: DGC 
Tras ese largo periodo endorreico, el sistema lacustre rebosó o resultó colmatado de sedimento, formándose el actual río Ebro, que ha erosionado y transportado al delta más de 30,000 km3 del antiguo relleno de la Cuenca del Ebro. Hoy, el sedimento preservado más elevado está precisamente en la zona central de la misma, en la Sierra de Alcubierre, 20 km al este de Zaragoza y a 840 m sobre el nivel del mar (Imagen 1).
¿Porqué están más altos esos sedimentos en el centro de la cuenca, si los lagos deberían ocupar la zona topográficamente más baja? ¿Y porqué no rebosaron antes los lagos hacia el Mediterráneo, si la actual divisoria de la cordillera Costero-Catalana tiene lugares de menos de 500 m de altitud?

En ausencia de deformación tectónica (las cadenas montañosas circundantes ya se habían acabado de formar), los movimientos verticales de la superficie de la Tierra están generalmente relacionados con la isostasia: La erosión de la cuenca del Ebro supuso una descarga y un levantamiento (un rebote isostático) de la litosfera terrestre, que descansa sobre el manto como si se tratara de un iceberg en el océano.
5. Hundimiento isostático que sufre la litosfera (en gris) sobre la
astenosfera fluida (blanco) cuando sobre ella descansa una carga (verde),
para 4 escenarios en los que la litosfera es progresivamente más delgada y débil.
En el escenario de una litosfera muy gruesa y rígida no se producen movimientos verticales
de reajuste. En el caso más débil, cada columna del sistema se reajusta localmente y
tiene el mismo peso si se mide hasta un nivel de compensación en la astenosfera. Autor: DGC
En nuestro artículo de esta semana, hemos calculado estos movimientos verticales de la litosfera terrestre para poder estimar el volumen de sedimento erosionado que falta en la cuenca del Ebro. Comparándolo con el volumen actualmente acumulado en el delta del Ebro, hemos podido establecer la edad en la que se produjo la colmatación, el relleno máximo de la cuenca, entre 7.5 y 12.0 millones de años, así como la altitud original que alcanzó la cuenca: 535–750 m sobre el nivel actual del mar.
6. Animation (reload page if necessary): Estimated topographic evolution of the Ebro Basin (NE, Spain) since 10 million years ago until present


7. Las cuencas endorreicas (zonas que no drenan sus aguas al mar) suelen presentar sistemas lacustres que son extremadamente sensibles a las variaciones climáticas, pues en ellos la superficie lacustre se debe adaptar para compensar la lluvia recogida con la evaporación en su superficie.

2014-03-26

49 Open Challenges in Earth Science - The Known Unknowns

Mapping Ignorance
ResearchBlogging.org
What keeps Earth scientists busy? These 49 open scientific questions aim at providing an updated, fully-referenced account of the main current scientific questions, disputes, and challenges in Geoscience.


[updated version in this link]


The Early Earth and the Solar System

Advances such as those occurred in the geochemistry of meteorites lead to new exciting hypotheses about the early stages of our planet, but as usual, answers are outnumbered by the new knowledge gaps: 
  1. How did the Earth and other planets form? Were planets formed in situ? Or are orbital changes relatively frequent? What determined the different deep layering of the solar planets? [McKinnon, 2012, Science on Mercury] 
  2. Was there ever a collision of the Earth with another planet Theia, giving birth to our satellite? [Canup, 2013, Science] There is compelling evidence, such as measures of a shorter duration of the Earth's rotation and lunar month in the past, pointing to a Moon much closer to Earth during the early stages of the Solar System. [Williams, CSPG Spec. Pubs., 1991]
  3. What is the long-term heat balance of Earth? How did its internal temperature decay since it formed by accretion of chondrites? How abundant are radiogenic elements in the interior? Did a "faint young sun" ever warm a "snowball Earth"? [WiredMarty et al., 2013, Science]
  4. What made plate tectonics a dominant process only on Earth? [outreach paper] How did the planet cool down before plate tectonics?[Moore & Webb, 2013, Nature] Was the Earth's crust formed during the early stages of its evolution or is it the result of a gradual distillation of the mantle that continues today along with crustal recycling? Is the crust still growing or does its recycling compensate for crust formation at mid-ocean ridges and other volcanic areas?
  5. How inherent to planetary evolution is the development of life conditions? [Zimmer, 2005, ScienceElkins-Tanton, 2013, Nature] Earth-like planets are now known to be abundant in our galaxy (two out of three stars may have one [e.g., Cassan et al., 2012, Nature]), but how many of them develop widespread durable water chemistry? How much of our water supplied by comets or asteroids? When and how did it reach the Earth? [outreach article]

Earth’s Interior

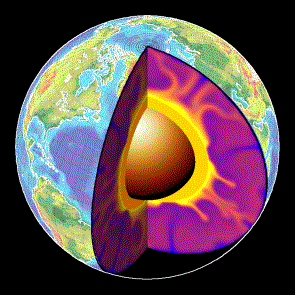
Our rock-sampling reach is limited to the upper 12 km of the Earth's crust, but the keys to extend our knowledge often lay far deeper than that. Indirect measurements such as seismic wave tomography, together with geodynamic and petrological modeling, become crucial: 
  1. What are the chemical composition and mechanical properties of rocks in the Earth’s mantle at the extreme pressure and temperature they undergo? As planets age and cool off, their internal and surface processes coevolve, chemically and mechanically, shaping also the atmospheric composition. Therefore this question has direct implications for our understanding of the environmental evolution of the Earth. [Kerr, 2005, Science]
  2. What are the dynamic processes in the Earth interior that accommodate and fuel plate tectonics? As seismometers spread more evenly over the planet's surface, the seismic imaging of the interior will rapidly improve, providing a detailed distribution of seismic wave velocity. Simultaneously, lab-based mineral physics must better constrain what these mechanical wave velocities tell us about the hot, deep rocks of uncertain composition in the mantle. Only then will computer models be able to test the proposed geodynamic models by trying to fit quantitatively those data and other geophysical observations such as gravity variations. [ref.3]
  3. Sedimentary and volcanic rocks have recorded changes of the magnetic field throughout the evolution of the Earth. What causes the sudden reversals of the paleomagnetic field? How does the geomagnetic field link to the iron convection properties at the deep Earth? Or inversely, what can we learn about the mechanical behavior of the materials at those depths from the geomagnetic field? [more context in Nature] Are the magnetic reversals too fast to be related to core dynamics? [example.1] [ex.2] [ex.3] Could their frequency be related to the distribution of tectonic plates? [GRL article]. What causes superchrons (periods longer than 10 Myr without magnetic reversals)? Something internal to the core, or induced externally by the mantle/subducting slabs? Was the geomagnetic field always dipolar, or was it more asymmetric in the past? [introduction]
  4. Are intraplate hotspots really made by deep sources of uprising materials (mantle plumes) coming from the deepest Earth's mantle? Or can they be explained by shallower convection? [e.g., Morgan, 1971; see also this recent Geology paper on Yellowstone].
  5. What is the history of and what controls the excursions of the rotation pole relative to the surface geography, known as true polar wander? [ex]
  6. What are the properties of deep rocks? How can we translate the heterogeneity in density, seismic wave velocity, or electromagnetic resistivity presently observed in the mantle and the lithosphere into variations of the mineralogical composition? And how do these measures relate to the dynamics of the Earth and to key mechanical properties such as the viscosity? [Faccenna & Becker, 210, Nature]. 
  7. What are the causes for Large Igneous Provinces and massive flood basalts such as the Columbia River Basalts?

Tectonic-plate motion and deformation 

The successful adoption of the plate tectonics paradigm has lead to a myriad of new questions about its limits and about the lessons for risk mitigation.
Velocity of the earth's surface at the Indian-Asian collision,
from GPS data. Blue star indicates the 2008 China earthquake.
Source: CALTECH
  1. What is the relative importance of the forces driving plate tectonics: slab pull, slab suction, mantle drag, and ridge push? [e.g., Conrad & Lithgow-Bertelloni, 2004; Negredo et al., GRL, 2004, vs. van Benthem & Govers, JGR, 2010]. What is the force balance and the geochemical cycle in subduction zones? [Emry et al., 2014, JGR] How much water (and how deep) penetrates into the mantle? [Ranero et al., 2003, Nature] How much subcontinental erosion takes place under subduction areas? [Ranero et al., 2000, Nature]
  2. What happens after the collision of two continents? Does continental collision diminish the rate of plate subduction, as suggested by the slab-pull paradigm? [Alvarez, EPSL, 2010How frequent are the processes of mantle delamination and slab break-off? What determines their occurrence? [Magni et al., GRL, 2013; Durezt & Gerya, Tectonoph., 2013]
  3. Why are orogens curved when seen from space? [Weil & Sussman, 2004, GSASP 383]
  4. How does the long-term deformation derived from paleomagnetism and structural geology link quantitatively to the present-day motions derived from GPS and from neotectonic patterns of crustal deformation? [Calais et al., EPSL, 2003] How do these last two relate to each other? [ref] Can we learn from regional structure of the crust/lithosphere from that link (or viceversa)? 
  5. Are plate interiors moving in steady-state linear motion? How rigid are these and why/when did they deform? [Davis et al., (2005) doi:10.1038/nature04781, and Wernicke & Davis, (2010) doi:10.1785/gssrl.81.5.694]
  6. How is the relative motion between continents accommodated in diffuse plate boundaries? (eg., the Iberian/African plate boundary). What determines the (a)seismicity of a plate contact? 
  7. How/when does deformation propagate from the plate boundaries into plate interiors? [e.g., Cloetingh et al., 2005, QSR] 
  8. What is the rheological stratification of the lithosphere: like a jelly sandwich? Or rather like a creme brulée? [Burov & Watts, 2006]. Is the lower crust ductile? Is strength concentrated at the uppermost mantle? Or just the other way around? [e.g., McKenzie et al., 2000, JGR; Jackson, 2002, GSA TodayHandy & Brun, 2004; and a nice recent post]
  9. Add caption
      Does the climate-controlled erosion and surface transport of sediment modify the patterns of tectonic deformation? Does vigorous erosion cause localized deformation in the core of mountain belts and prevent the propagation of tectonic shortening into the undeformed forelands? Does the deposition of sediment on the flank of mountains stop the frontal advance of the orogen? Is there any field evidence for these effects predicted from computer models? [Philip Allen's blog] [Willett, 1999, JGRWhipple, 2009Garcia-Castellanos, EPSL, 2007]
    1. Can earthquakes be predicted? [Heki, 2011, GRLFreed, 2012, Nat.Geosc.]. How far away can they be mechanically triggered? [Tibi et al., 2003, Nature]. Little is known about how faults form and when do they reactivate [ex.6], and even worse, there seems to be no clear pathway as to solve this problem in the near future. Unexpected breakthroughs needed. 
    2. How can the prediction of volcanic eruptions be improved? What determines the rates of magma accumulation in the chamber and what mechanisms make magmas eruptible? [ex.7][ex.7b]
    3. In many regions, the elevation of the continents does not match the predictions from the classical principle of isostasy for the Earth's outer rigid layer (the lithosphere). This deviation is known as dynamic topography, by opposition to isostatic topography. But what are the mechanisms responsible? Can we learn about the mantle dynamics by estimating dynamic topography? [ref.1Can the hidden loads needed to explain the accumulation of sediment next to orogens (foreland basins) be linked to these dynamic forces? [Busby & Azor, 2012, Wiley]
    4. How do land-forming processes react to climate change at a variety of scales, ranging from the Milankovitch cycles to the late Cenozoic cooling of the Earth? Is there a feedback from erosion into climate at these time scales, through the Carbon cycle and the weathering of silicates, for example? What is the role of the surface uplift and erosion of Tibet on the drawdown of atmospheric CO2 over the Cenozoic? [Garzione, 2008, Geology]

    Earth's landscape history and present environment

    The shape of the planet's solid surface, its topography, is the key feature that connects many of the disciplines within Earth science, probably because it is the feature that most affects our daily life. It is today common wisdom that landscape forms from a complex interplay between tectonics and climate, through a list of mechanical, chemical, and biological processes acting at the surface of the Solid Earth. Topographic data is becoming now available at resolutions finer than a few meters, and the sedimentary record is also being archived at unprecedented rates. But:
    Drainage patterns in Yarlung Tsangpo River, China (NASA)

    1. Can we use these data to derive past tectonic and climatic conditions? Will we ever know enough about the erosion and transport processes? Was also the stocasticity of meteorological and tectonic events relevant in the resulting landscape? And how much has life contributed to shape the Earth's surface? 
    2. Can classical geomorphological concepts such as 'peneplanation' or 'retrogressive erosion' be understood quantitatively? Old mountain ranges such as the Appalachian or the Urals seem to retain relief for > 10^8 years, while fluvial valleys under the Antarctica are preserved under moving ice of kilometric thickness since the Neogene. What controls the time-scale of topographic decay? [Egholm, 2013, Nature]
    3. What are the erosion and transport laws governing the evolution of the Earth’s Surface?[Willenbring et al., Geology, 2013] Rivers transport sediment particles that are at the same time the tools for erosion but also the shield protecting the bedrock. How important is this double role of sediment for the evolution of landscapes? [Sklar & Dietrich, Geology, 2001 (tools and cover effect); Cowie et al., Geology, 2008 (a field example)].
    4. Can we predict sediment production and transport for hazard and scientific purposes? [NAS SP report, 2010Geology, 2013] 
    5. Smaller-scale patterns at the limit
      between river channels and hillslopes.
      Credit: Perron Group, MIT
    6. What do the preserved 4D patterns of sediment flow tell us from the past of the Earth? Is it possible to quantitatively link past climatic and tectonic records to the present landforms? Is it possible to separate the signals of both processes? [e.g., Armitage et al., 2011, Nature Geosc]. 
    7. Can we differentiate changes in the tectonic and climate regimes as recorded in sediment stratigraphy? Some think both signals are indeed distinguishable [Armitage et al., 2011, Nat.Geo.]. Others (Jerolmack & Paola, 2010, GRL], argue that the dynamics intrinsic to the sediment transport system can be 'noisy' enough to drown out any signal of an external forcing. 
    8. Does surface erosion draw hot rock towards the Earth’s surface? Do tectonic folds grow preferentially where rivers cut down through them, causing them to look like up-turned boats with a deep transverse incision? [Simpson, 2004, Geology]
    9. How resilient is the ocean to chemical perturbations? What caused the huge salt deposition in the Mediterranean known as the Messinian Salinity Crisis? Was the Mediterranean truly desiccated? What were the effects on climate and biology, and what can we learn from extreme salt giants like this? [e.g., Hsu, 1983Clauzon et al., Geology, 1996; Krijgsman et al, 1999, NatureGarcia-Castellanos & Villaseñor, Nature, 2011]. Were the normal marine conditions truly reestablished by the largest flood documented on Earth, 5.3 million years ago? [Garcia-Castellanos et al., 2009, Nature]
      Artistic view of the refilll of the
      Mediterranean after the Messinian salinity
      crisis. Authors: Pibernat & Garcia-Castellanos.
      Downloadable here.
    10. How do the patterns of river networks form? [eg. Devauchelle et al., 2012, PNAS; Perron et al., 2012, Nature]. And what information about the past do these patterns contain? Can we quantitatively reconstruct past ecology or climate from old river patterns? [e.g., Hartley et al., 2010, J. Sedim. Res.]
    11. Do we need a new geological epoch called Anthropocene? When do the Homo Sapiens start to have a significant impact on the Earth System? 8000 BP?[Ruddiman, 2003, Climatic Change]; 2000 BP? [Scalenghe, 2011, The Holocene]; 1850 AD? [Crutzen & Steffen, 2003]

    Climate, Life, and Earth

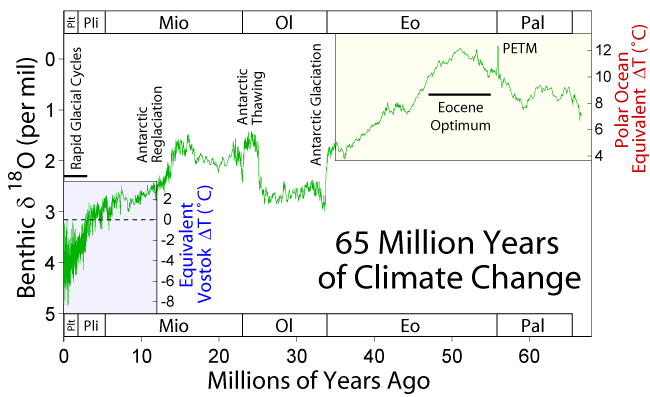
    Source: R.E..Rhode, Wikipedia
    The geological record shows that climate is relatively stable over tectonic time-scales whereas it undergoes abrupt changes in periods ranging from decades to hundreds of thousand years. Past periods when the planet underwent extreme climate conditions may help to understand the mechanisms behind that behavior and its significance for the evolution of the Solid Earth.

    1. What caused the largest carbon isotope changes in Earth? [Grotzinger et al., 2011, Nat. Geosc.] How does Earth’s climate system respond to elevated levels of atmospheric CO2? 
    2. Was there ever a snow-ball Earth during the earliest stages of Life on Earth? 
    3. Were there also rivers and lakes on Mars? [Hans, 2012] Were there large outburst floods similar to those on Earth
    4. What were the causes and what shaped the recovery from mass extinctions as those at the K-T boundary, the Permian-Triassic or the Late Triassic? Massive volcanism? Meteorites? Microbes? [recent papers: ex.8ex.9ex.10, Rothman et al., 2014, PNAS]
    5. What triggered the extreme climatic variability during the Quaternary and the roughly coeval acceleration in continental erosion and sediment delivery to the margins? [Peizhen, Molnar et al., 2001, Nature; Herman et al., 2013, NatureWas this related to the tectonic closure of the Central American Seaway? How do these climate events translate quantitatively into sea level changes?
    6. How do climate changes translate quantitatively into sea level changes? How do ice sheets and sea level respond to a warming climate? What controls regional patterns of precipitation, such as those associated with monsoons or El Niño?
    7. What caused the Quaternary extinction(s)? Human expansion? Climate Change? How sensitive are ecosystems and biodiversity to environmental change? Was the large fauna extinction ~13,000 yr ago a result of the Younger Dryas climatic event? Was this caused by an extraterrestrial impact? [ex.11ex.12] Or may it be linked to the outburst of Lake Agassiz
    8. How relevant are subsurface microorganisms to earth dynamics by controlling soil formation and the methane cycle? What are the origin, composition, and global significance of deep subseafloor communities? What are the limits of life in the subseafloor realm?  
    9. The atmosphere is shaped by the presence of life, a powerful chemical force. The Earth’s evolution has seems to affect the evolution of life [see the Cambrian explosion of animal life, for instance; plus this recent paper on that]. To what extent? And how much control has life on climate? [another recent one]. Is it possible to quantify these links to make reliable predictions that allow filling the data gaps or assessing the chances for extraterrestrial life?
    10. How much of the present climate change is anthropogenic? How will growing emissions from a growing global population with a growing consumption impact on climate? 

    Broader open questions


    1. Many of the questions above are related to the extreme diversity of spatial scales of Earth processes. Direct observation (by sampling or remotely) is mostly limited to a thin layer around the solid surface of the Earth, and physical experimentation is limited to the pressures of the uppermost layers of the planet. Many processes including plate tectonics are known to be driven by the nature of the materials that make up the planet interiors, down to the smallest atomic scales, as thought for instance for the trigger of earthquakes. Answers may arrive via new devices and analytical tools working at the high pressures and temperatures of Earth’s interior.
    2. Time scales also pose a problem to know the mechanical and chemical properties of Earth's materials. Partly because we deal with time scales in very different orders of magnitude while we are limited to make observations from the present. But also because scaling the rates of lab experiments (e.g., mineral physics) or analogue models (e.g., sandbox experiments) with the corresponding geological scenarios is not always convincing. 
    3. Implementing Episodicity in Gradualism: For historical reasons, geology has generally underestimated the role of episodicity in nature. However, there is a growing view that exceptional events and stochasticity have a relevant role in many of Earth's subsystems. An example for this is the preeminence of flooding events (larger than average) in erosion and surface sediment transport and during the evolution of landscape, and the importance of upscaling flood stochasticity into sediment transport models [eg., Lague, 2010, JGR]. Climate variability at all time-scales has been already mentioned above. Even plate tectonics may have been episodic (during the Archean at least, [ref]).  4D hyperscale data sets in geomorphology are increasingly showing the limits of smooth-process approaches. Future understanding of the Earth will benefit from incorporating the full frequency spectrum (the episodicity) in modeling natural phenomena, rather than systematically approaching these as gradual processes. 
    4. Computer models tell whether the complexity of nature can be explained by the interplay between simple processes, but: how can we further model the Earth as a complex system of complex systems? And when can we expect ‘compact’ explanations? 

    General background:
      Note that the specific references given above for each open question are sometimes just examples and may not always be the best representative. Furthermore, the list is surely biased towards Solid Earth Science, my own field. The following general references can give you an alternative perspective on the subject.
      Please send additions/suggestions to d.g.c@csic.es

      Acknowledgements:
      For various inputs/criticisms to this list: Brian Romans, Umberto Lombardo, Jean Braun, Mikael Attal, Alexandra Witze, Michael Klaas, Matt Hall, Chris Rowan.
      PD: I published a shorter version of this post in Mapping Ignorance. -Daniel