2014-03-26

49 Open Challenges in Earth Science - The Known Unknowns

Mapping Ignorance
ResearchBlogging.org
What keeps Earth scientists busy? These 49 open scientific questions aim at providing an updated, fully-referenced account of the main current scientific questions, disputes, and challenges in Geoscience.


[updated version in this link]


The Early Earth and the Solar System

Advances such as those occurred in the geochemistry of meteorites lead to new exciting hypotheses about the early stages of our planet, but as usual, answers are outnumbered by the new knowledge gaps: 
  1. How did the Earth and other planets form? Were planets formed in situ? Or are orbital changes relatively frequent? What determined the different deep layering of the solar planets? [McKinnon, 2012, Science on Mercury] 
  2. Was there ever a collision of the Earth with another planet Theia, giving birth to our satellite? [Canup, 2013, Science] There is compelling evidence, such as measures of a shorter duration of the Earth's rotation and lunar month in the past, pointing to a Moon much closer to Earth during the early stages of the Solar System. [Williams, CSPG Spec. Pubs., 1991]
  3. What is the long-term heat balance of Earth? How did its internal temperature decay since it formed by accretion of chondrites? How abundant are radiogenic elements in the interior? Did a "faint young sun" ever warm a "snowball Earth"? [WiredMarty et al., 2013, Science]
  4. What made plate tectonics a dominant process only on Earth? [outreach paper] How did the planet cool down before plate tectonics?[Moore & Webb, 2013, Nature] Was the Earth's crust formed during the early stages of its evolution or is it the result of a gradual distillation of the mantle that continues today along with crustal recycling? Is the crust still growing or does its recycling compensate for crust formation at mid-ocean ridges and other volcanic areas?
  5. How inherent to planetary evolution is the development of life conditions? [Zimmer, 2005, ScienceElkins-Tanton, 2013, Nature] Earth-like planets are now known to be abundant in our galaxy (two out of three stars may have one [e.g., Cassan et al., 2012, Nature]), but how many of them develop widespread durable water chemistry? How much of our water supplied by comets or asteroids? When and how did it reach the Earth? [outreach article]

Earth’s Interior

Our rock-sampling reach is limited to the upper 12 km of the Earth's crust, but the keys to extend our knowledge often lay far deeper than that. Indirect measurements such as seismic wave tomography, together with geodynamic and petrological modeling, become crucial: 
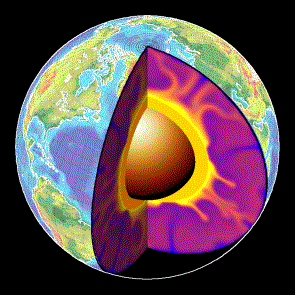
  1. What are the chemical composition and mechanical properties of rocks in the Earth’s mantle at the extreme pressure and temperature they undergo? As planets age and cool off, their internal and surface processes coevolve, chemically and mechanically, shaping also the atmospheric composition. Therefore this question has direct implications for our understanding of the environmental evolution of the Earth. [Kerr, 2005, Science]
  2. What are the dynamic processes in the Earth interior that accommodate and fuel plate tectonics? As seismometers spread more evenly over the planet's surface, the seismic imaging of the interior will rapidly improve, providing a detailed distribution of seismic wave velocity. Simultaneously, lab-based mineral physics must better constrain what these mechanical wave velocities tell us about the hot, deep rocks of uncertain composition in the mantle. Only then will computer models be able to test the proposed geodynamic models by trying to fit quantitatively those data and other geophysical observations such as gravity variations. [ref.3]
  3. Sedimentary and volcanic rocks have recorded changes of the magnetic field throughout the evolution of the Earth. What causes the sudden reversals of the paleomagnetic field? How does the geomagnetic field link to the iron convection properties at the deep Earth? Or inversely, what can we learn about the mechanical behavior of the materials at those depths from the geomagnetic field? [more context in Nature] Are the magnetic reversals too fast to be related to core dynamics? [example.1] [ex.2] [ex.3] Could their frequency be related to the distribution of tectonic plates? [GRL article]. What causes superchrons (periods longer than 10 Myr without magnetic reversals)? Something internal to the core, or induced externally by the mantle/subducting slabs? Was the geomagnetic field always dipolar, or was it more asymmetric in the past? [introduction]
  4. Are intraplate hotspots really made by deep sources of uprising materials (mantle plumes) coming from the deepest Earth's mantle? Or can they be explained by shallower convection? [e.g., Morgan, 1971; see also this recent Geology paper on Yellowstone].
  5. What is the history of and what controls the excursions of the rotation pole relative to the surface geography, known as true polar wander? [ex]
  6. What are the properties of deep rocks? How can we translate the heterogeneity in density, seismic wave velocity, or electromagnetic resistivity presently observed in the mantle and the lithosphere into variations of the mineralogical composition? And how do these measures relate to the dynamics of the Earth and to key mechanical properties such as the viscosity? [Faccenna & Becker, 210, Nature]. 
  7. What are the causes for Large Igneous Provinces and massive flood basalts such as the Columbia River Basalts?

Tectonic-plate motion and deformation 

The successful adoption of the plate tectonics paradigm has lead to a myriad of new questions about its limits and about the lessons for risk mitigation.
Velocity of the earth's surface at the Indian-Asian collision,
from GPS data. Blue star indicates the 2008 China earthquake.
Source: CALTECH
  1. What is the relative importance of the forces driving plate tectonics: slab pull, slab suction, mantle drag, and ridge push? [e.g., Conrad & Lithgow-Bertelloni, 2004; Negredo et al., GRL, 2004, vs. van Benthem & Govers, JGR, 2010]. What is the force balance and the geochemical cycle in subduction zones? [Emry et al., 2014, JGR] How much water (and how deep) penetrates into the mantle? [Ranero et al., 2003, Nature] How much subcontinental erosion takes place under subduction areas? [Ranero et al., 2000, Nature]
  2. What happens after the collision of two continents? Does continental collision diminish the rate of plate subduction, as suggested by the slab-pull paradigm? [Alvarez, EPSL, 2010How frequent are the processes of mantle delamination and slab break-off? What determines their occurrence? [Magni et al., GRL, 2013; Durezt & Gerya, Tectonoph., 2013]
  3. Why are orogens curved when seen from space? [Weil & Sussman, 2004, GSASP 383]
  4. How does the long-term deformation derived from paleomagnetism and structural geology link quantitatively to the present-day motions derived from GPS and from neotectonic patterns of crustal deformation? [Calais et al., EPSL, 2003] How do these last two relate to each other? [ref] Can we learn from regional structure of the crust/lithosphere from that link (or viceversa)? 
  5. Are plate interiors moving in steady-state linear motion? How rigid are these and why/when did they deform? [Davis et al., (2005) doi:10.1038/nature04781, and Wernicke & Davis, (2010) doi:10.1785/gssrl.81.5.694]
  6. How is the relative motion between continents accommodated in diffuse plate boundaries? (eg., the Iberian/African plate boundary). What determines the (a)seismicity of a plate contact? 
  7. How/when does deformation propagate from the plate boundaries into plate interiors? [e.g., Cloetingh et al., 2005, QSR] 
  8. What is the rheological stratification of the lithosphere: like a jelly sandwich? Or rather like a creme brulée? [Burov & Watts, 2006]. Is the lower crust ductile? Is strength concentrated at the uppermost mantle? Or just the other way around? [e.g., McKenzie et al., 2000, JGR; Jackson, 2002, GSA TodayHandy & Brun, 2004; and a nice recent post]
  9. Add caption
      Does the climate-controlled erosion and surface transport of sediment modify the patterns of tectonic deformation? Does vigorous erosion cause localized deformation in the core of mountain belts and prevent the propagation of tectonic shortening into the undeformed forelands? Does the deposition of sediment on the flank of mountains stop the frontal advance of the orogen? Is there any field evidence for these effects predicted from computer models? [Philip Allen's blog] [Willett, 1999, JGRWhipple, 2009Garcia-Castellanos, EPSL, 2007]
    1. Can earthquakes be predicted? [Heki, 2011, GRLFreed, 2012, Nat.Geosc.]. How far away can they be mechanically triggered? [Tibi et al., 2003, Nature]. Little is known about how faults form and when do they reactivate [ex.6], and even worse, there seems to be no clear pathway as to solve this problem in the near future. Unexpected breakthroughs needed. 
    2. How can the prediction of volcanic eruptions be improved? What determines the rates of magma accumulation in the chamber and what mechanisms make magmas eruptible? [ex.7][ex.7b]
    3. In many regions, the elevation of the continents does not match the predictions from the classical principle of isostasy for the Earth's outer rigid layer (the lithosphere). This deviation is known as dynamic topography, by opposition to isostatic topography. But what are the mechanisms responsible? Can we learn about the mantle dynamics by estimating dynamic topography? [ref.1Can the hidden loads needed to explain the accumulation of sediment next to orogens (foreland basins) be linked to these dynamic forces? [Busby & Azor, 2012, Wiley]
    4. How do land-forming processes react to climate change at a variety of scales, ranging from the Milankovitch cycles to the late Cenozoic cooling of the Earth? Is there a feedback from erosion into climate at these time scales, through the Carbon cycle and the weathering of silicates, for example? What is the role of the surface uplift and erosion of Tibet on the drawdown of atmospheric CO2 over the Cenozoic? [Garzione, 2008, Geology]

    Earth's landscape history and present environment

    The shape of the planet's solid surface, its topography, is the key feature that connects many of the disciplines within Earth science, probably because it is the feature that most affects our daily life. It is today common wisdom that landscape forms from a complex interplay between tectonics and climate, through a list of mechanical, chemical, and biological processes acting at the surface of the Solid Earth. Topographic data is becoming now available at resolutions finer than a few meters, and the sedimentary record is also being archived at unprecedented rates. But:
    Drainage patterns in Yarlung Tsangpo River, China (NASA)

    1. Can we use these data to derive past tectonic and climatic conditions? Will we ever know enough about the erosion and transport processes? Was also the stocasticity of meteorological and tectonic events relevant in the resulting landscape? And how much has life contributed to shape the Earth's surface? 
    2. Can classical geomorphological concepts such as 'peneplanation' or 'retrogressive erosion' be understood quantitatively? Old mountain ranges such as the Appalachian or the Urals seem to retain relief for > 10^8 years, while fluvial valleys under the Antarctica are preserved under moving ice of kilometric thickness since the Neogene. What controls the time-scale of topographic decay? [Egholm, 2013, Nature]
    3. What are the erosion and transport laws governing the evolution of the Earth’s Surface?[Willenbring et al., Geology, 2013] Rivers transport sediment particles that are at the same time the tools for erosion but also the shield protecting the bedrock. How important is this double role of sediment for the evolution of landscapes? [Sklar & Dietrich, Geology, 2001 (tools and cover effect); Cowie et al., Geology, 2008 (a field example)].
    4. Can we predict sediment production and transport for hazard and scientific purposes? [NAS SP report, 2010Geology, 2013] 
    5. Smaller-scale patterns at the limit
      between river channels and hillslopes.
      Credit: Perron Group, MIT
    6. What do the preserved 4D patterns of sediment flow tell us from the past of the Earth? Is it possible to quantitatively link past climatic and tectonic records to the present landforms? Is it possible to separate the signals of both processes? [e.g., Armitage et al., 2011, Nature Geosc]. 
    7. Can we differentiate changes in the tectonic and climate regimes as recorded in sediment stratigraphy? Some think both signals are indeed distinguishable [Armitage et al., 2011, Nat.Geo.]. Others (Jerolmack & Paola, 2010, GRL], argue that the dynamics intrinsic to the sediment transport system can be 'noisy' enough to drown out any signal of an external forcing. 
    8. Does surface erosion draw hot rock towards the Earth’s surface? Do tectonic folds grow preferentially where rivers cut down through them, causing them to look like up-turned boats with a deep transverse incision? [Simpson, 2004, Geology]
    9. How resilient is the ocean to chemical perturbations? What caused the huge salt deposition in the Mediterranean known as the Messinian Salinity Crisis? Was the Mediterranean truly desiccated? What were the effects on climate and biology, and what can we learn from extreme salt giants like this? [e.g., Hsu, 1983Clauzon et al., Geology, 1996; Krijgsman et al, 1999, NatureGarcia-Castellanos & Villaseñor, Nature, 2011]. Were the normal marine conditions truly reestablished by the largest flood documented on Earth, 5.3 million years ago? [Garcia-Castellanos et al., 2009, Nature]
      Artistic view of the refilll of the
      Mediterranean after the Messinian salinity
      crisis. Authors: Pibernat & Garcia-Castellanos.
      Downloadable here.
    10. How do the patterns of river networks form? [eg. Devauchelle et al., 2012, PNAS; Perron et al., 2012, Nature]. And what information about the past do these patterns contain? Can we quantitatively reconstruct past ecology or climate from old river patterns? [e.g., Hartley et al., 2010, J. Sedim. Res.]
    11. Do we need a new geological epoch called Anthropocene? When do the Homo Sapiens start to have a significant impact on the Earth System? 8000 BP?[Ruddiman, 2003, Climatic Change]; 2000 BP? [Scalenghe, 2011, The Holocene]; 1850 AD? [Crutzen & Steffen, 2003]

    Climate, Life, and Earth

    Source: R.E..Rhode, Wikipedia
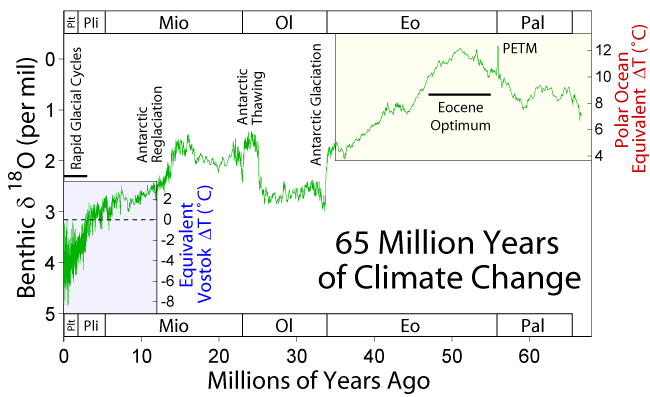
    The geological record shows that climate is relatively stable over tectonic time-scales whereas it undergoes abrupt changes in periods ranging from decades to hundreds of thousand years. Past periods when the planet underwent extreme climate conditions may help to understand the mechanisms behind that behavior and its significance for the evolution of the Solid Earth.

    1. What caused the largest carbon isotope changes in Earth? [Grotzinger et al., 2011, Nat. Geosc.] How does Earth’s climate system respond to elevated levels of atmospheric CO2? 
    2. Was there ever a snow-ball Earth during the earliest stages of Life on Earth? 
    3. Were there also rivers and lakes on Mars? [Hans, 2012] Were there large outburst floods similar to those on Earth
    4. What were the causes and what shaped the recovery from mass extinctions as those at the K-T boundary, the Permian-Triassic or the Late Triassic? Massive volcanism? Meteorites? Microbes? [recent papers: ex.8ex.9ex.10, Rothman et al., 2014, PNAS]
    5. What triggered the extreme climatic variability during the Quaternary and the roughly coeval acceleration in continental erosion and sediment delivery to the margins? [Peizhen, Molnar et al., 2001, Nature; Herman et al., 2013, NatureWas this related to the tectonic closure of the Central American Seaway? How do these climate events translate quantitatively into sea level changes?
    6. How do climate changes translate quantitatively into sea level changes? How do ice sheets and sea level respond to a warming climate? What controls regional patterns of precipitation, such as those associated with monsoons or El Niño?
    7. What caused the Quaternary extinction(s)? Human expansion? Climate Change? How sensitive are ecosystems and biodiversity to environmental change? Was the large fauna extinction ~13,000 yr ago a result of the Younger Dryas climatic event? Was this caused by an extraterrestrial impact? [ex.11ex.12] Or may it be linked to the outburst of Lake Agassiz
    8. How relevant are subsurface microorganisms to earth dynamics by controlling soil formation and the methane cycle? What are the origin, composition, and global significance of deep subseafloor communities? What are the limits of life in the subseafloor realm?  
    9. The atmosphere is shaped by the presence of life, a powerful chemical force. The Earth’s evolution has seems to affect the evolution of life [see the Cambrian explosion of animal life, for instance; plus this recent paper on that]. To what extent? And how much control has life on climate? [another recent one]. Is it possible to quantify these links to make reliable predictions that allow filling the data gaps or assessing the chances for extraterrestrial life?
    10. How much of the present climate change is anthropogenic? How will growing emissions from a growing global population with a growing consumption impact on climate? 

    Broader open questions


    1. Many of the questions above are related to the extreme diversity of spatial scales of Earth processes. Direct observation (by sampling or remotely) is mostly limited to a thin layer around the solid surface of the Earth, and physical experimentation is limited to the pressures of the uppermost layers of the planet. Many processes including plate tectonics are known to be driven by the nature of the materials that make up the planet interiors, down to the smallest atomic scales, as thought for instance for the trigger of earthquakes. Answers may arrive via new devices and analytical tools working at the high pressures and temperatures of Earth’s interior.
    2. Time scales also pose a problem to know the mechanical and chemical properties of Earth's materials. Partly because we deal with time scales in very different orders of magnitude while we are limited to make observations from the present. But also because scaling the rates of lab experiments (e.g., mineral physics) or analogue models (e.g., sandbox experiments) with the corresponding geological scenarios is not always convincing. 
    3. Implementing Episodicity in Gradualism: For historical reasons, geology has generally underestimated the role of episodicity in nature. However, there is a growing view that exceptional events and stochasticity have a relevant role in many of Earth's subsystems. An example for this is the preeminence of flooding events (larger than average) in erosion and surface sediment transport and during the evolution of landscape, and the importance of upscaling flood stochasticity into sediment transport models [eg., Lague, 2010, JGR]. Climate variability at all time-scales has been already mentioned above. Even plate tectonics may have been episodic (during the Archean at least, [ref]).  4D hyperscale data sets in geomorphology are increasingly showing the limits of smooth-process approaches. Future understanding of the Earth will benefit from incorporating the full frequency spectrum (the episodicity) in modeling natural phenomena, rather than systematically approaching these as gradual processes. 
    4. Computer models tell whether the complexity of nature can be explained by the interplay between simple processes, but: how can we further model the Earth as a complex system of complex systems? And when can we expect ‘compact’ explanations? 

    General background:
      Note that the specific references given above for each open question are sometimes just examples and may not always be the best representative. Furthermore, the list is surely biased towards Solid Earth Science, my own field. The following general references can give you an alternative perspective on the subject.
      Please send additions/suggestions to d.g.c@csic.es

      Acknowledgements:
      For various inputs/criticisms to this list: Brian Romans, Umberto Lombardo, Jean Braun, Mikael Attal, Alexandra Witze, Michael Klaas, Matt Hall, Chris Rowan.
      PD: I published a shorter version of this post in Mapping Ignorance. -Daniel

      2014-02-14

      How to refill the Mediterranean?

      Mapping Ignorance
      ResearchBlogging.org
      Let me tell a story about serendipity in research, a story that involves abrupt changes in the Earth's landscape and a 5-million-year-old flood of unprecedented scale.


      Classical authors such as Aristotle, Galileo, or Leonardo da Vinci, used to describe the birth of the Mediterranean Sea as an enormous flood through the Strait of Gibraltar that filled a desiccated basin. These stories trace back to the oldest known encyclopedia: Plinius' Historia Naturalis (1st century AD). In its 3rd volume, Plinius the Elder recounted a legend from southern Hispania that attributed the formation of the Strait of Gibraltar to Hercules, the god who "allowed the entrance of the ocean where it was before excluded". The Atlantic Ocean flooding a desertic Mediterranean Sea at epic scales. Amazingly enough, the geophysical and geological research carried out in the last decades seems to suggest that this ancient vision may be quite appropriate.

      Since the identification of vast salt strata throughout the Mediterranean by Austrian naturalist Karl Mayer (late nineteenth century) we know that the marine connections between this sea and the Atlantic Ocean became small by the end of the Miocene, during a period known as the Messinian age. Modern chronostratigraphy has dated this at 6 to 5.3 million years ago, around the time when our earliest hominin ancestors started walking on two legs in Central Africa. As a result, the Mediterranean became a huge salt pan that accumulated about 10% of the salt dissolved in the world's oceans, during the so-called Messinian salinity crisis. The ongoing tectonic uplift of the Gibraltar Arc region finally emerged the last Atlantic seaway and isolated completely the Mediterranean from the ocean, about 5.6 million years ago. The Mediterranean then became largely evaporated as a result of the dry climate of its watershed. Finally, about 5.3 million years ago the Mediterranean was refilled from the Atlantic through the Strait of Gibraltar. The indications that this occurred geologically very fast (namely, the abrupt change from Miocene to Pliocene sedimentary layers) made this event be known as the Zanclean flood.
      Simulation of the refill through the strait of Gibraltar
      by Steven N. Ward (Univ. California).
      Note the water velocity distribution around 1:27.

      Geological map of the Gibraltar strait locating the
      erosion channel (red) observed with geophysical
      methods.
      The flood along the Gibraltar threshold may have been caused by its subsidence below the Atlantic level, or by faulting, or by erosion (or a combination of these three proposed mechanisms). But beyond the causes for the flood, another key unknown is the abruptness and evolution of the flood itself: From the sharp transition in the sedimentary layer record, it is widely thought (though not unanimously) that the event was very fast. But in geology fast can mean a hundred thousand years. Because little was known about its dynamics, and perhaps because for geologists rapid major events are rare and challenge the principle of uniformitarianism, the flood duration underwent a wide range of estimations from tens to tens of thousands of years.

      Before knowing anything about the Messinian Mediterranean, I used to model the evolution of landscape over geological time scales, particularly interested on the role of lakes in controlling the long-term evolution of topography of large continental regions.

      Lakes are those water bodies collecting precipitation in local topographic minima (yes, this sounds a bit Sheldon-like). Lakes are usually ephemeral over geologic timescales: Unless there are vertical tectonic motions enlarging the topographic basin, they soon fill up with sediment, overspilling their banks. When the water finds a way out, it incises along the outlet, drawing the lake's level down, and propagating this erosion upstream into the lake. In our landscape evolution models this transition was systematically very fast, but this result was not convincing enough for two reasons: First, lake data to compare with were scarce, and we were in the need of a large case scenario where traces of erosion were more evident. Secondly, our models where not accounting for transitory water flow, but instead it was calculating a steady flow (i.e., the water precipitation equals the water losses through evaporation at each time step of the simulation).

      2D simulation of the evolution of a tectonic lake 
      formed in front of a growing tectonic barrier. 
      The lake evaporates the water collected from 
      the left side. When the barrier stops growing, 
      its erosion leads to a sudden capture of the lake.

      Then I accidentally learned about the Messinian salinity crisis, about its impact in the Mediterranean evolution, and about the megaflood hypothesis for its ending. It struck me that the feedback between water flow and incision we envisaged for lakes should be similar during the Zanclean flood, taking the global ocean as a huge lake on the verge of overtopping towards the dry Mediterranean. Combining the formulation of river incision with the proper hydrodynamic equations, we built a simple but robust mathematical formulation for overtopping outburst floods. We used then erosional parameters derived from the study or mountain river incision, and then incorporated a reconstruction for the Mediterranean seafloor geometry. Then we started running virtual floods. 

      The first results were so surprising that we thought something was probably wrong with the code. Things were happening much faster than in those lake scenarios we were used to. Because in the Zanclean flood the source is virtually infinite, the Mediterranean was filling in only a few years along a large erosion channel excavated across the Strait of Gibraltar, some hundred meters deep. Unfortunately, the results were strongly dependent on a parameter that is badly constrained: the erodibility of rocks. But if that was correct, we should be able to find traces of the flood erosion preserved under the sedimentary layers in the strait. 

      Dry Mediterranean, by Roger Pibernat.
      So we turned towards previously published research, finding two other pieces of evidence: The first was a vintage seismic image showing a cross-section of the sedimentary layers near the strait area (Campillo et al., 1992). It showed a clear channel running west to east from the strait into the Alborán Sea, carved in the pre-Messinian sediments. The channel had previously been thought to be the result of river erosion of the dried-up strait, but there’s no obvious large river that could have produced that erosion. The second piece of evidence came from cores of rock drilled from the strait area as part of the exploration for the Africa-Europe tunnel project that would build a train connection between Spain and Morocco (Blanc, 2002). These cores also showed a channel deeper than 200 m, wider than 3 km, and filled with post-Messinian sediment. Altogether, the documented erosion valley connecting the Eastern Atlantic to the Western Mediterranean is more than 200-kilometre long. If this were a result of fluvial erosion, it would be strange to find erosion on both sides of the present water divide between Atlantic and Mediterranean. Furthermore, rather than a waterfall over the Gibraltar Strait as previously suggested, the seismic data show a huge ramp, several kilometres wide descending rather gradually from the Atlantic to the Mediterranean.

      With these data, we turned again to the models. Using the observed erosion depth and width as a constrain, the model estimated now that the flood may have began slowly, taking up to several thousand years before a significant rise in Mediterranean level occurred. But importantly they also show that 90% of the water must have entered in a period shorter than two years, and that at the peak discharge, water poured in at a rate of 100 million cubic meters per second, about a thousand times the largest river on Earth today. If 'harder' erosion parameters were used, then the refill of the Mediterranean would be predicted to be slower, but the calculated erosion at the end of the flood would be insufficient to reproduce the geophysical images. To fit the observations, the flooding channel had to cut down into the bedrock almost half a meter per day, leading to a large inlet flow that would increase the Mediterranean sea level by more than 10 meters per day.

      The technique does not allow constraining the speed of the initial stages, nor the mechanisms involved in triggering the flood. This means that the initial trigger may have been a geologically modest event such a large storm, a tsunami, or a partial collapse of the dividing barrier. What the results do ensure is that in order to account for the final size of the erosion channel, 90% of the water must have been rapidly transferred in a period ranging from a few months to two years.

      Possible evolution of the flood derived from the model. The lower panel shows the evolution of the seaway depth as it is eroded by the increasing flow of water (black lines, left scale) and the rising Mediterranean level (red lines). From our article in Nature. 

      If these observations and calculations are independently confirmed, the Zanclean flood would become the largest known flood on Earth's history. The Zanclean flood involved an order of magnitude more water flow than the megafloods that we know took place during the last deglaciation (e.g., the Missoula floods or the Bonneville flood). 

      The implications of such a rapid flooding are inevitably big, as a large number of multidisciplinary studies have documented: Global flora and fauna had to adapt to the new environmental conditions rapidly. Marine species colonized a huge new realm rapidly whereas for land species, particularly in islands, the flooded Mediterranean became a sudden barrier triggering speciation. Had the land connection remained, it could have facilitated an earlier arrival of early humans in western Europe. Instead early humans had to take a circuitous route to Western Europe and didn't arrive until 1.5 million years ago. The Messinian salinity crisis also highlights the importance of seaways in understanding the geological record: straits limit the mix with the global ocean and their size is the key parameter modulating the chemical registry found in sediment. The flood may also have had tectonic implications: The weight of the flooding waters is such that it should have modified the rotation of the Earth, and it should have made the entire Mediterranean region sink by at least one kilometer in the mantle, according to the principle of Isostasy. Also global climate surely must have been impacted by the Messinian salinity crisis and its rapid ending, but so far this is perhaps the most elusive aspect of the crisis, something remarkable since I am not aware of other scenarios in geological history where the climatic response to such a large environmental change can be better tested.

      So there are plenty of open questions on the Zanclean Flood that need an answer. More pending Retos Terrícolas.

      Video on the Atlantropa Project, showing the collapse of a 
      projected dam across the Strait of Gibraltar.

      [This is related to research of our own group here at CSIC, as published in this article]
      [This post has been published in Mapping Ignorance]

      References:
      • Blanc, P.-L. The opening of the Plio-Quaternary Gibraltar Strait: assessing the size of a cataclysm, Geodin. Acta 15, 303—317 (2002).
      • Campillo, A., Maldonado, A. & Mauffret, A., Stratigraphic and tectonic evolution of the western Alboran sea: Late Miocene to recent, Geo Mar. Lett., 12, 165– 172 (1992).
      • Garcia-Castellanos, D., 2006. Long-term evolution of tectonic lakes: Climatic controls on the development of internally drained basins. In: Tectonics, Climate, and Landscape evolution. Eds.: S.D. Willett, N. Hovius, M.T. Brandon & D.M. Fisher. GSA Special Paper 398. 283-294. doi:10.1130/2006.2398(17) [pdf]
      • Garcia-Castellanos, D., F. Estrada, I. Jiménez-Munt, C. Gorini, M. Fernàndez, J. Vergés, R. De Vicente, 2009. Catastrophic flood of the Mediterranean after the Messinian salinity crisis. Nature 462, 778-781 doi:10.1038/nature08555 [pdf]

      2013-11-27

      How old is Earth Science?

      Many geoscientists think of their field as not much older than Lyell or Hutton; as a science that bloomed sometime during the eighteenth century. Nevertheless, the term geology was first used by Ulisse Aldrovandi in 1603 (Vai and Cavazza, 2003) and introduced as a regular term by Horace de Saussure in 1779. The danish scholar Nicolas Steno (1638-1686) set the bases for stratigraphy: the law of superposition and the principle of original horizontality.

      But the roots of the scientific interest for the history of the Earth are even deeper than that.

      Ortelius' world map, inspiring his own anticipation of
      continental drift
      In 1596 Abraham Ortelius, a flemish geographer serving the Spanish crown, wrote: "America (...) was (...) torn away from Europe and Africa, by earthquakes and flood" "the vestiges of the rupture reveal themselves: if someone brings forward a map of the world and considers carefully the coasts of the three aforementioned parts of the earth, where they face each other". This quotation extraordinarily anticipated by more than three centuries the theory of continental drift, but it remained forgotten and was rediscovered only in 1994.
      Ortelius' idea was in turn a direct result of the vast exploration discoveries that took place in the previous decades. In the words of Alvarez & Leitao (2012, Geology): "The Iberian Voyages of Discovery of the fifteenth and sixteenth centuries marked a major advance in the understanding of the Earth—the greatest advance since antiquity, and comparable in scope and importance with the Geological Revolution, the Darwinian Revolution, and the Plate Tectonic Revolution, and we encourage geologists and other Earth scientists to embrace the Voyages as part of our geological scientific heritage."
      This Edmund Halley’s map of geomagnetic declination (~1700 
      AD) came about two centuries later than similar studies by 
      Portuguese explorers, who used these magnetic anomalies for the 
      long-lived challenge of determining longitude during navigation.

      The practical drive behind those first geoscientific questions? In the 16th century, "the Portuguese began to make systematic surveys of magnetic declination by comparing the direction of a compass needle with the line of shadow of the Sun at local noon". Magnetic declination could in this way be used to estimate the geographical longitude, a fundamental navigation problem at the time which final solution had to wait for the eighteenth century, when accurate chronometers were first developed. In fact, it turns out that the phenomenon was well known since centuries earlier, and by 1492, Columbus first described the agonal line in the Atlantic Ocean, where the compass points exactly to the geographic pole.

      In 1736, a franco-spanish expedition is set to south America to determine the size and shape of the globe, whether it is flattened or elongated at its poles, a long standing scientific question at the time. The expedition included Charles de La Condamine, Jussieu, Pierre Bouguer, Jorge Juan & Antonio de Ulloa. Several books were published out of these expeditions that had great novelty and impact at the time. Juan & Ulloa's (Relacion historica del viage a la America Meridional hecho de orden de S. Mag. para medir algunos grados de meridiano terrestre y venir por ellos en conocimiento de la verdadera figura y magnitud de la tierra, con otras observaciones astronomicas y phisicas), was published 3 years after La Condamine's but showed far more detail, maps and illustrations.
      Juan & Ulloa's cover, 1748


      In summary, the systematic study of the Earth has a history behind as long as in any other scientific field. Quoting again A&L: geoscientists can "trace their intellectual ancestry back to the Copernican Revolution of the 16th and 17th centuries, just as astronomers and physicists do".

      References:
      • Alvarez & Leitao, 2010, Geology, 38, 231–234, doi: 10.1130/G30602.1
      • Romm, James, Nature 367, 407-408, 1994, A new forerunner for continental drift. doi:10.1038/367407a0
      • G. B. Vai et W. Cavazza, ed, Four centuries of the word 'Geology', Ulisse Aldrovandi 1603 in Bologna, Minerva Edizioni, Bologna, 2003

      2013-10-31

      Geociencia, Wikipedia y Arte. La experiencia wikiArS

      [Presentación del proyecto wikiArS: Barcelona, Miércoles 20 de Noviembre]

      En una experiencia pionera, escuelas de arte, Wikimedia, e investigadores del CSIC y de la UB estamos colaborando desde hace dos años para contribuir contenidos gráficos para la obra de referencia más consultada: Wikipedia.

      Escasez de contenidos científicos en Wikipedia

      Wikipedia no sólo es la mayor enciclopedia y la mayor obra colaborativa que ha existido, sino que también es el único de los 10 sitios más visitados de internet que no tiene ánimo de lucro, ni publicidad, ni coste de acceso. Lo que comenzó en 2001 como uno de los primeros experimentos de la Web2.0 se ha convertido en la obra de referencia más completa y de mejor calidad (ref1, ref2) y en el principal canal de acceso al conocimiento, acercándolo a cualquier escuela u hogar con conexión a internet. Gracias a la libertad de copia de sus contenidos, han habido también muchas experiencias de reutilización de ese conocimiento, por ejemplo produciendo ediciones impresas de la enciclopedia para lugares del planeta donde el acceso a la red no es aún sencillo.
      Para seguir siendo una obra de referencia gratuita y reutilizable, Wikipedia sólo puede incorporar texto y gráficos de dominio público o con licencias libres, que puedan ser reproducidos libremente para cualquier uso (comercial, obras derivadas mejoradas o adaptadas...). Por eso muchas entradas de temas científicos en Wikipedia carecen de imágenes adecuadas: porque la mayoría de las imágenes que aparecen en publicaciones científicas están sujetas a copyright y su inclusión en Wikipedia podría poner a la enciclopedia libre en dificultades legales. Hay otras razones para la falta de contenidos científicos, sobretodo en las versiones no inglesas, pero esa es otra historia.
      El propósito de la presente colaboración es llenar este vacío de contenidos construyendo un puente entre Wikipedia, la academia científica, y las escuelas de ilustración. La iniciativa se llama wikiArS.

      wikiArS

      wikiArS está coordinado desde Wikimedia por David Gómez. Un grupo de estudiantes de varias escuelas de arte y publicidad (Llotja de Barcelona, edRa de Rubí, Serra i Abella de l'Hospitalet y la escuela de arte de Manresa y de la Universidad de Cádiz) hace sus prácticas profesionales con encargos para ilustrar artículos de Wikipedia que no tienen imágenes. En el caso de ilustraciones didácticas de temas técnicos es necesario un asesoramiento científico, y éste comenzó de forma experimental desde las Ciencias de la Tierra. Como frutos de la colaboración hay que destacar las ilustraciones y videos sobre la crisis salina del Messiniense y sobre los megacristales de las cuevas de Naica. Pero wikiArS aspira a sentar precedente e involucrar otras disciplinas científicas como la arqueología, la historia o la biología y otras escuelas de arte y diseño se están incorporando a la iniciativa. Ya han sido ilustrados decenas de artículos gracias a unas 120 ilustraciones producidas en este proyecto. 

      Ilustración fruto de wikiArS explicando el cierre del último canal de conexión entre el Mediterráneo y el Atlántico, que condujo a la desecación parcial del primero durante la Crisis Salina Mesiniense hace 5,96 millones de años. La viñeta recrea el tránsito de mamíferos, como camélidos y gerbillos, a través del estrecho de Gibraltar. Autor: Pau Bahí con asesoramiento de Garcia-Castellanos, licencia CC-SA. 


      Los cristales de yeso la cueva de Naica (México) son los más grandes que se conocen (la persona en la parte inferior derecha da idea de la escala). Autor: Van Driessche. Licencia: CC-BY 3.0. 


      Ilustración de wikiArS mostrando la zona y los procesos en la mina de Naica (México) en la que se formaron los cristales. Autor: Albert Vila i Andreu Módenes, con asesoramiento de Angels Canals. Licencia: CC-BY 3.0.

      La labor del asesor científico (que no necesariamente tiene que ser un investigador senior) es orientar al ilustrador. La secuencia de cada encargo suele ser:
      1. El asesor científico o cualquiera de los otros participantes identifican un artículo de Wikipedia que necesite una ilustración. El artículo es sobre un tema que el asesor conoce profesionalmente. No importa el idioma del artículo seleccionado pues el proyecto wikiArS y las ilustraciones que resulten son translingüísticos.
      2. El asesor especifica los contenidos generales de la ilustración mediante un formulario online.
      3. El coordinador de wikiArS y u otros wikipedistas involucrados como tutores, en contacto con las escuelas, encuentran los estudiantes de artes en prácticas que escojan el encargo y lo lleven a cabo.
      4. El estudiante ilustrador realiza el trabajo con la supervisión de su profesor.
      5. El asesor supervisa la parte científica del trabajo y da el visto-bueno para su publicación.
      6. Una vez lista, se sube la ilustración al repositorio de commons, que generalmente acaba en el artículo de Wikipedia correspondiente, en función de su calidad y del consenso que alcancen los wikipedistas.

      Más detalles sobre cómo funciona WikiArS.
      El próximo miércoles 20 de noviembre (2013) presentaremos resultados de esta iniciativa en el salón de actos del ICTJA-CSIC, Barcelona.

      Para el asesor, el proyecto es una oportunidad de producir material didáctico sobre su tema de estudio, facilitando su alcance social y la difusión (outreach). Para el estudiante de arte, es una oportunidad de realizar sus prácticas en un contexto aplicado, público y con mucha visibilidad, al tiempo que contribuyen a un bien público que se está construyendo colaborativamente y que es útil a mucha gente.

      Ver todas las ilustraciones del proyecto en https://commons.wikimedia.org/wiki/Category:Contributions_from_art_and_design_schools

      Imágenes libres

      Las imágenes suelen utilizar una licencia libre Creative Commons Reconocimiento Compartir Igual 3.0. En caso de utilizarlas es necesario citar en el pie el nombre del autor y la licencia.

      Al publicar sus obras en el fondo Wikimedia Commons los estudiantes las están poniendo a disposición de Wikipedia y también de toda la sociedad. Los estudiantes escogen con qué licencia, entre las que admite este fondo, quieren publicar su trabajo. Cada imagen tiene su página informativa donde consta el autor, la licencia de publicación, una descripción escrita, una nota indicando que se ha publicado a través de una colaboración wikiArS.

      Wikimedia Commons sólo admite archivos con licencias libres que permitan la reproducción y la creación de obras derivadas para cualquier uso, incluido el comercial, siempre que se cite el autor y la licencia. La mayoría de estudiantes han optado por la licencia recomendada, la Creative Commons Reconocimiento Compartir Igual, que es una licencia copyleft. Esto significa que, en caso de crear obras derivadas, éstas deberán seguir siendo libres, utilizando la misma licencia.

      Enlaces de interés:

      http://en.wikipedia.org/wiki/Reliability_of_Wikipedia
      http://thecollegevoice.org/2011/11/14/our-love-affair-with-wikipedia/
      http://chronicle.com/article/The-Undue-Weight-of-Truth-on/130704/


      Entidades colaboradoras
      Escuela Superior de Arte y Diseño Llotja (Barcelona)
      www.llotja.cat
      Es la escuela de arte más veterana de España, fundada en 1775. Actualmente es un centro público dependiente del Consorcio de Educación de Barcelona que ofrece estudios de grado universitario y ciclos formativos de grado medio o superior en el campo del arte y el diseño, además de monográficos especializados. El de Ilustración es un Ciclo Formativo de Grado Superior al que los estudiantes acceden con un nivel de bachillerato y que deben completar haciendo un periodo de prácticas profesionales. 


      Escuela de Arte y Diseño edRa (Rubí)
      http://artedra.net/
      Es una escuela de titularidad municipal creada en 1937 que actualmente ofrece ciclos formativos de grado medio y superior en el campo del arte y el diseño. El de Arte Final es un Ciclo Formativo de Grado Medio que finaliza con la realización de un Proyecto Final.

      Otras escuelas y centros educativos involucrados (incluídas Escuelas "Art del Treball" de Barcelona y "Pau Gargallo" de Badalona):
      https://outreach.wikimedia.org/wiki/WikiArS/Schools

      Amical Wikimedia
      www.wikimedia.cat
      Es una asociación sin ánimo de lucro formada por gente que apoya a la Wikimedia Fundation con proyectos de la WF con el objetivo de que el conocimiento humano esté disponible en catalán. 

      Wikimedia España
      http://www.wikimedia.org.es/
      Esta asociación la formamos para dar apoyo a los objetivos de Wikimedia desde España, por ejemplo negociando la liberación de derechos de autor de obras producidas por entidades públicas o con dinero público.  

      CSIC y Universidad de Barcelona
      http://www.ictja.csic.es/
      Las primeras colaboraciones de investigadores vinieron del ámbito de la geociencia. En concreto de nuestro Instituto de Ciencias de la Tierra Jaume Almera (Consejo Superior de Investigaciones Científicas, Barcelona) y posteriormente de la facultad de Geología de la UB.


      Enlace: Página sobre el proyecto en la wiki de Wikimedia Outreach:

      2013-09-19

      Megainundaciones por desbordamiento de lagos

      [Update: my conference on this subject at the PAGES meeting, 2017]

      Las inundaciones desencadenadas por el desbordamiento de grandes lagos han sido mayores en el pasado geológico que las inundaciones de origen meteorológico que conocemos históricamente. El fenómeno geológico es el mismo que el que tiene lugar cada vez que un corrimiento de tierras o una avalancha de roca bloquea el valle de un río de montaña, creando un nuevo lago: A veces la barrera colapsa por la presión del agua antes de que el lago rebose, de forma parecida a las inundaciones producidas por el colapso de lenguas glaciares que bloquean el cauce de un río. Pero aún cuando el lago rebose, aunque inicialmente lo haga con poca descarga de agua, existe el riesgo de que lo haga de forma abrupta, con caudales enormes que pueden causar importantes pérdidas humanas y económicas río abajo. Esto es debido a la erosión que realiza el agua en el canal de salida, que se retroalimenta con el flujo de agua que permite evacuar.
      Esquema de la retroalimentación entre flujo de agua y erosión del desaguadero de un lago de montaña.
      Los datos acumulados sobre el flujo de agua que se alcanza en estos desbordamientos y sus efectos geomorfológicos están sirviendo para estimar empíricamente el riesgo en escenarios naturales. Los resultados son bastante intuitivos: indican que cuanto mayor es el tamaño del lago y mayor la erodabilidad (debilidad) de la barrera, más intenso será el pico de descarga de agua tras el desbordamiento. Pero la predictibilidad que proporcionan estos resultados es muy limitada porque las heterogeneidades de la barrera pueden ser tan determinantes como los factores anteriores. Una sola roca de gran tamaño puede retrasar la erosión del desaguadero y evitar la inundación.  
      Este sigue siendo el video que mejor muestra la fuerza a la que puede conducir un desbordamiento (en este caso el mar desborda sobre una mina a cielo abierto). Se trata de la Pantai Remis landslide, que ocurrió en Malasia en 1993.

      Pero podría haber otra manera de aprovechar esos datos: modelar numéricamente este tipo de escenarios sí podría servir para estimar la importancia de este tipo de desbordamientos en la evolución del relieve a escalas de tiempo geológico. Varios estudios recientes (e.g., Egholm et al., 2013, Nature) muestran la importancia de la retención de sedimento en los valles fluviales en determinar la evolución del relieve continental. Un modelo cuantitativo del desbordamiento de grandes lagos que permita reproducir los datos de descarga de agua implicada en estas inundaciones podría, en particular, dar luz sobre cuánto vale y de qué depende la propia erodabilidad de las presas naturales, dejando aparte las heterogeneidades, para luego entender mejor la evolución del relieve terrestre: los desbordamientos catastróficos son poco frecuentes en comparación con la erosión gradual del relieve, pero podrían ser relevantes debido a su enorme intensidad. Para ello se podrían integrar modelos numéricos existentes de erosión en ríos de montaña (modelos de evolución del relieve desarrollados por la comunidad geomorfológica y geofísica) con modelos del flujo de agua durante el desbordamiento de lagos (desarrollados principalmente por la comunidad hidrológica).
      Time lapse del desbordamiento de una presa de tierra 
      en Oregón (Marmot Dam, Sandy River, Oregon)

      Pero veamos algunos precedentes a estos estudios: Desde las exploraciones de Gilbert en el Lago Bonneville (Gilbert, 1890), se han acumulado numerosas evidencias de que el desbordamiento de lagos puede desencadenar inundaciones de mayor intensidad que las registradas históricamente. Si los desbordamientos documentados históricamente alcanzan los 105 m3/s (la mitad del débito medio actual del río Amazonas, esto ocurrió p.e. tras el bloqueo del río Yigong por una avalancha en 2000), hay numerosos escenarios geológicos que presentan evidencias de débitos de agua mucho mayores. Los mejor documentados son las inundaciones del Lago Missoula (O'Connor & Baker, 1992) y el río Ob en las Cordillera de Altai (Herget, 2005), pero estos casos consisten en roturas de presas de hielo formadas por lenguas glaciares de edad Pleistocena, y por tanto no están relacionados con la resistencia de la roca. En cambio, el desbordamiento del Lago Bonneville (Jarrett & Malde, 1987) tuvo lugar al sobrepasar su nivel la barrera topográfica formada por un delta fluvial (detritos poco consolidados) a unos 1500 m sobre el nivel del mar. Finalmente, la mayor inundación que se ha documentado es la Inundación Zancleense, que puso fin a la Crisis de Salinidad Messiniense hace 5.33 millones de años (e.g., Blanc, 2006; Garcia-Castellanos et al., 2009), tras el desbordamiento del Océano Atlántico sobre un Mediterráneo parcialmente desecado (el consenso en este caso no es completo). La compilación más completa de este tipo de eventos puede encontrarse en O'Connor & Beebee (2009).

      Gracias a estos estudios y a experimentos realizados con barreras de tierra o arena, junto con los escenarios naturales pleistocenos (O'Connor & Beebee, 2009), disponemos de datos sobre la descarga de agua que se extienden a lo largo de 10 órdenes de magnitud en términos de volumen de agua total evacuada. La figura 1 muestra los escenarios naturales mejor estudiados (los de volúmenes más importantes).

      Datos sobre inundaciones debidas a roturas de presas naturales, compilados por O’Connor & Beebee (2010). Descarga máxima de agua frente al volumen total de agua. Los datos se extienden a 10 órdenes de magnitud en términos de volumen. Sólo se incluyen las presas naturales que cedieron por rebose (y no por infiltración o colapso).


      Estos datos han servido para estimar empíricamente el riesgo en escenarios naturales. Se aplica habitualmente en el desalojo de valles fluviales cuando un río ha sido bloqueado por una avalancha de roca, como ocurrió en el río Hunza (sin consecuencias) o como en el desbordamiento e inundación en 1963 del Lago Issyk (Gerasimov, 1963) o el actual Lago Sarez (localización en este enlace), que presenta todavía riesgo de un desbordamiento catastrófico.

      Por último, como curiosidad, el proceso de desbordamiento de lagos ha sido propuesto también como origen de la morfología de algunos de los mayores canales erosivos de la superficie de Marte (ver el libro ‘Megaflooding on Earth and Mars’, por Burr et al., 2009).


      Referencias:
      Burr, D.M., Baker, V.R., Carling, P.A. (Eds), 2009. Megaflooding on Earth and Mars. Cambridge University Press. 319 pp.
      Garcia-Castellanos, D., 2006. Long-term evolution of tectonic lakes: Climatic controls on the development of internally drained basins. In: Tectonics, Climate, and Landscape evolution. Eds.: S.D. Willett, N. Hovius, M.T. Brandon & D.M. Fisher. GSA Special Paper 398. 283-294. doi: 10.1130/2006.2398(17).
      Garcia-Castellanos, D., F. Estrada, I. Jiménez-Munt, C. Gorini, M. Fernàndez, J. Vergés, R. De Vicente, 2009. Catastrophic flood of the Mediterranean after the Messinian Crisis. Nature, 462, 778-781. doi:10.1038/nature08555
      Gerasimov, V.A. (1965). Issykskaia katastrofa 1963 g. i otrazhenie ee in geomorfoogii doliny r. Issyk. [The Issyk catastrophe in 1963 and its effect on geomorphology of the 166 Jim E. O’Connor and Robin A. Beebee Issyk River valley.] Akademiia Nauk SSSR, Izvestiia Vsesoiuznogo, Geograficheskogo Obshchestva, 97–6, 541–547. (En ruso, disponemos de traducción).
      Gilbert, Grove Karl, 1890. Lake Bonneville. 438 p., 51 leaves of plates. Monographs of the United States Geological Survey, v. 1.
      O’Connor, J.E. & Beebee, R.A., 2009, Floods from natural rock-material dams, in Burr, D., Carling, P., and Baker, V. editors, Megafloods on Earth and Mars: Cambridge University Press.
      O’Connor, J.E., 1993, Hydrology, Hydraulics, and Geomorphology of the Bonneville Flood: Geological Society of America Special Paper 274, 83 p.
      O’Connor, J.E., & Baker, V.R., 1992, Magnitudes and implications of peak discharges from Glacial Lake Missoula: Geological Society of America Bulletin, v. 104, p. 267–279, doi:10.1130/0016-7606(1992)104<0267:maiopd>2.3.CO;2.
      Walder, J.S. & O’Connor, J.E., 1997: Methods for predicting peak discharge of floods caused by failure of natural and constructed earthen dams. Water Resources Research 33: 2337–2348.

      2013-07-13

      Descent to the Thrihnukagigur volcanic conduit, Iceland

      [location map]
      A few days ago I joined a descent to the Þríhnúkagígur volcanic conduit in Iceland. It consists of a 150-meter vertical descent along a volcanic pipe. This lava conduit was abruptly emptied of lava during the last eruption in the area, about 4500 years ago. The reason for the emptying may have been that the magma chamber found an easier (lower?) exit to the surface. Thanks to that you can actually walk down there today and see exciting things. Some of them I suspect are the erosive marks left by outflowing rocks. There are also solidified droplets of magma falling along the walls of the crater as this became empty. More interestingly, you can see that the pipe is elongated and at its two extremes there is a near-vertical fault. The magma may have taken advantage of this fault when searching its way to the surface. There is some limited scientific literature that i did not yet check, so take this critically since i am not a volcanologist.
      Here are some videos of the event:


      Unsurprisingly but nicely, the fault is oriented in NE-SW direction, as usual for the SW Icelandic portion of the Mid-Atlantic ridge. Part of the 2 cm/year of the spreading between Eurasia and North America is sometimes taking place here.

      One of the cracks along the North-Atlantic ridge, a few hundred
      meters from the crater.
      Eurasia to your left, N.America to the right.

      Looking upwards towards the entrance to the cave. Note the elongated shape
      of the pipe when looking upward toward the surface.
      I guess this reflects the fault plane along which the pipe formed. 
      The fault in one of the edges of the conduit. Its continuation could be followed behind the camera. 
      All together the descent is a very recommendable experience if you are a geoscientist, if you love volcanos, or if you are just rich. It's organised by the consortium Inside the Volcano.

      More pictures of the trip here.