2015-11-16

How do we know that the Earth has a core?


1. A typical depiction of the core
of the Earth.

Many of us have wondered, at some point of our lives, why the cartoons depicting the Earth as a watermelon with a missing portion always show this ball in the center named the 'core'. How do we know that a distinct 'body' is actually down there, 2900 km below the surface?

Let's see: we know the total mass of the Earth through its gravitational interaction with the solar system. In 1797, Cavendish [ref.1] measured the Gravitational constant G and the density of the Earth is ever since known to be about 5.51 times the density of water: nearly twice the average rock density we find at the surface.

In 1898, Wiechert suggested [ref.2] that this high Earth’s density could be explained by a core in the center made of nickel and iron (like many meteorites known at the time) surrounded by a shell, or mantle, of the lighter silicon-dominated rocks that we see in the surface.

2. Inge Lehmann was one of the key
discoverers of the inner core of the Earth.
But only in 1906, Richard D. Oldham found that the increasing speed of seismic waves with depth within the Earth holds only down to 2890 km below the surface. Deeper than that, the mechanical (acoustic) waves propagate much slower (fig. 6), suggesting a different rock nature. Because this distinct material did not transmit shear seismic waves, it became clear that this core is liquid.

But in 1936, Inge Lehmann (picture on the right) found that the center of the core is indeed nearly-solid, since she inferred weak shear waves travelling through it [ref. 4] using highly-sensitive seismometers in New Zealand. This has become known as the inner core.


3. Images of the tsunami following last week's earthquake in Chile.

Today, detecting the core down there has become a doable task for anyone. Last week's earthquake in Chile, for example, provides a great opportunity for you to check if Oldham did everything right. You only need to get seismograms from seismic stations around the world (many of these stations have their data available online, real time), and sort the signals according to the distance from the station to the EQ's epicenter, using the same time of reference, like in this image:
4. Left: Each horizontal line is a seismogram of the Chile earthquake recorded at different locations of the planet (check USGS: 2015-10-16; Mw=8.3). Each seismogram is plotted according to the distance of the measuring station to the earthquake (vertical axis). The red circle shows the signal gap due to the outer core.
Right: Same image, with the identification of the arrivals of the different seismic waves. 'P' waves are the compressional waves, they are first to arrive all around the planet's surface.
The horizontal axis shows elapsed time, measured since the EQ occurred.
The vertical axis shows the distance from the measuring station to the EQ.
The red circle shows the region (around 110 degrees from the source) where the first seismic waves are not recorded. 

5. Seismic shadow produced by an imaginary
earthquake occurring at the north pole. The
outer core, due to its slower seismic velocity,
refracts the mechanical waves of the earthquake,
shadowing a vast region of the planet, as seen
in figure 4.
6. The velocity of seismic waves
changes with depth within the Earth.


In summary: the absence of wave reception in regions around 14,000 km (between 103 and 143 degrees) apart from the hypocenter demonstrates that there is a liquid core where seismic waves travel slow.
Isn't it amazing that nobody realized this before the 20th century?

Finally, remember that the outer core is where the magnetic field of the Earth is generated, by the thermal convection of conductive molten iron around a nearly-solid iron inner core. In fact the changes in the convection patterns in the outer core seem responsible for the rapid historical changes observed in the magnetic field. There is more about the magnetic field in this earlier post.

7. Convection in the iron-dominated outer core around
a nearly solid core is widely accepted as the cause for the 
Earth's magnetic field, and known as the geodynamo
(Glatzmaier & Roberts).
Update 2015-11: a new study suggests that the core (and thus the magnetic field) was formed by the gradual cooling of the Earth only 1 to 1.5 billion years ago.

Update 2015-12: Geophysicists call it the new core paradox: They can't quite explain how the ancient Earth could have sustained a magnetic field billions of years ago, as it was cooling from its fiery birth. Now, two scientists have proposed two different explanations. http://ow.ly/W3eQX

References (thank you nuclearplanet):
1. Cavendish, H., Experiments to determine the density of Earth. Philosophical Transactions of the Royal Society of London, 1798, 88, 469-479.
2. Wiechert, E., Über die Massenverteilung im Inneren der Erde. Nachr. K. Ges. Wiss. Goettingen, Math-Kl., 1897, 221-243.
3. Oldham, R. D., The constitution of the interior of the Earth as revealed by earthquakes. Q. T. Geol. Soc. Lond., 1906. 62, 459-486.
4. Lehmann, I., P'. Publ. Int. Geod. Geophys. Union, Assoc. Seismol., Ser. A, Trav. Sci., 1936, 14, 87-115.

2015-11-03

Conferencias de divulgación geocientífica (50 aniversario del ICTJA)

Con motivo del 50 aniversario de nuestro instituto, cuatro investigadores del ICTJA participamos en el ciclo de conferencias divulgativas en Barcelona: "Las Ciencias de la Tierra en nuestra vida cotidiana", dentro del Cicle Dilluns de Ciència del CSIC-Catalunya.

Lugar: (mapa)
Sala d’Actes de la Residència d’Investigadors,
CSIC-Catalunya,
Barcelona

La conferencias de divulgación son los siguientes lunes:

2 Novembre, 18:30 h,
Charles Darwin, Lord Kelvin, els radioisòtops i el concepte de Temps
Dr. Santiago Giralt

9 Noviembre, 18:30 h
Tambora, 200 años de la erupción que cambió el Mundo
Dra. Adelina Geyer

16 Noviembre, 18:30 h
Megainundaciones, placas tectónicas y la formación del relieve terrestre
Dr. Daniel García-Castellanos

23 Novembre, 18:30 h
Interacció radiació-matèria per a estudiar-ho gairebé tot: nanomaterials, minerals exòtics, obres d’art, cadàvers,...
Dr. Jordi Ibáñez

2015-08-06

Continental-scale evolution of topography and river networks. Tectonics and climate shaping Eurasia

[This post is about our recent publication on PLOS ONE]

How much does the erosion and sedimentation at the Earth’s surface influence on the patterns and distribution of tectonic deformation? This question has been mainly addressed from a computer modelling perspective, at scales ranging from local to orogenic. In the PLOS ONE paper published today, we present a model that aims at understanding this phenomenon at the continental scale, looking at the feedbacks between continental enlargement and climate aridification during the collision of continents.

60-million-year indentation of a continent from the south 
(at 50 mm/yr). 

Left: Topography and areas with precipitation
higher than 400 mm/yr (red shading). Note the 
orographic rainfall developing at the southern flank 
of the growing plateau. Wind blows from the southeast 
(towards the upper left corner).

Right: erosion and sedimentation rates, and
contours of crustal thickening rate due to tectonics. 

By Garcia-Castellanos & Jimenez-Munt, PLOS ONE, 2015. 
+ info here.

We couple a thin-sheet viscous model of continental deformation with a stream-power surface transport model. The model also incorporates flexural isostatic compensation that permits the formation of large sedimentary basins and a precipitation model that reproduces basic climatic effects such as continentality and orographic rainfall and rain shadow. We calculate the feedbacks between these four processes acting at different scales in a synthetic scenario inspired and scaled by the India-Asia collision. The model reproduces first-order characteristics of the growth of the Tibetan Plateau as a result of the Indian indentation.


Note that the southern continent (the indenter, India)
is chosen fixed to our reference frame, whereas
 the northern continent (Asia) is moving southwards). 


The initial topography is flat with small random noise
forming a network of lakes. 
The tectonic indenter in
the southern boundary represents India, while a rigid
block fixed around x=2500km represents the Tarim Basin. 


Wind blowing from SE at 7 m/s (relative humidity=1).
Red shading indicates orographic precipitation.


The continental deformation adopts a thin-sheet tectonic
model. 
+ info here.
What these simulations show is that, at large space and temporal scales, the climate dryness that develops in continental interiors triggers the trapping of sediment in closed basins within the continent, instead of exporting it to the continental margins. In the left panel you can see a large intramountain basin (comparable to the Tarim Basin) developing within Asia when a hard lithospheric region in predefined within the continent. The amount of sediment trapped in it is very sensitive to climatic parameters, particularly to evaporation, because it crucially determines its endorheic/exorheic drainage. We identify a feedback between erosion and crustal thickening leading locally to a <50 at="" climatically-enhanced="" concentrated.="" corners="" deformation="" flank="" growing="" in="" increase="" indenter="" is="" of="" orographic="" p="" place="" places="" plateau="" precipitation="" preferentially="" rates="" specially="" syntaxes="" takes="" the="" this="" upwind="" where="">
We hypothesize that this may provide clues for better understanding the mechanisms underlying the intriguing tectonic aneurysms documented in the Himalayas. At the continental scale, however, the overall distribution of topographic basins and ranges
seems insensitive to climatic factors, despite these do have important, sometimes counterintuitive effects on the amount of sediments trapped within the continent. The dry climatic conditions that naturally develop in the interior of the continent, for example, trigger large intra-continental sediment trapping at basins similar to the Tarim Basin because they determine its endorheic/exorheic drainage. These complex climatic-drainage-
tectonic interactions make the development of steady-state topography at the continental scale unlikely.

2015-07-30

Erosion in northern Spain (Ebro Basin)

The previous post dealt with the erosion of the Ebro Basin after its colmatation with sediment, about 10 million years ago. The journal Geology has just chosen the following picture to illustrate the cover of their August volume:

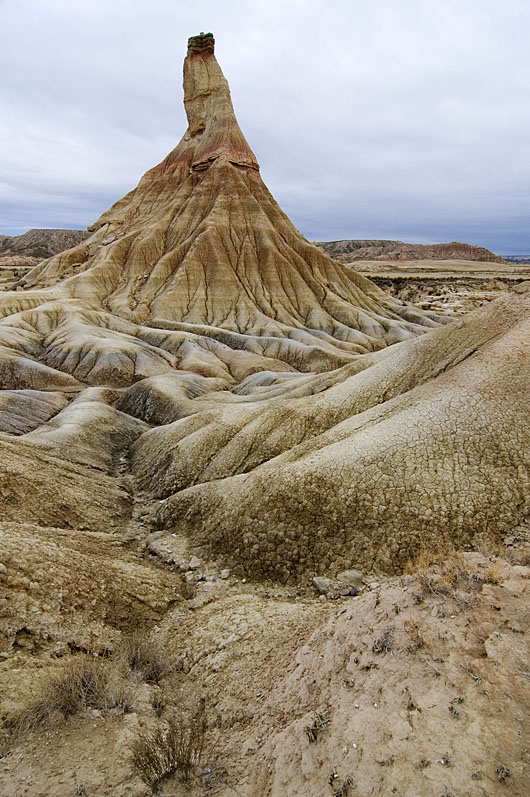
Castildetierra is one of the many hills sculpted by erosion of the ancient
sediment infill of the Ebro Basin at Bardenas Reales (Navarra, Spain). 

Photo: Larrión & Pimoulier.
Location: 42.2103 N, 1.5157 W
The soft alluvial clays that make most of this hill are interbedded with harder lacustrine limestones and fluvial sandstones. The same alternation prevails over much of the Ebro Basin (NE Spain). These strata record a 19-million-year-old lake and alluvial system in the centre of an endorheic Ebro basin (84,000 km2 in area). Subsequent basin capture and drainage integration towards the Mediterranean lead to erosional features like the one in the picture.

Despite the most recent sedimentary has been removed by erosion, our study could date this major drainage change at 12.0-7.5 million years ago, based on isostatic modeling constrained with paleomagnetic data. In these badlands at Bardenas Reales (Navarra), high erosion rates have been measured in the order of millimeters per year, but how these rates link to the long-term history of the region is unclear. Other places in the basin show Pleistocene erosion rates in the order of 0.1-0.4 mm/yr, whereas our results suggest an average erosion rate since the Miocene of 0.05-0.1 mm/yr.


Summary of the scientific article in Geology: Basins formed within mountainous regions often become perfect sedimentary traps that do not drain to the sea but to internal evaporitic lakes. When they do, their sediment layers ideally record the climatic, topographic, and tectonic history of the surroundings. And when these basins eventually overtop or overfill with sediment, they are rapidly excavated by the new outflowing fluvial network, exposing excellent stratigraphic outcrops. However, this erosion often removes the uppermost basin infill, and essential information about the late basin history is lost. We have estimated the timing and elevation of the maximum infill of the Ebro basin (NE Spain) by computing the rebound of the basin in response to erosion, adopting the common idea that the Earth's rigid outer shell (the lithosphere) rests on a fluid magmatic asthenosphere in an Archimedes-type equilibrium (isostasy). We combine these calculations with existing paleomagnetic ages of the sediment basin infill. The results show that the basin became overfilled between 12 and 7.5 million years ago, and that it reached a maximum elevation of up to 750 m above present sea level. The basin has been ever since incised at a rate close to 0.1 mm/yr and has been isostatically uplifted by up to 630 m at its center. This uplift may explain why the Ebro River, opposite to other large Mediterranean rivers, does not present a deep gorge excavated within its own basin during the desiccation of the Mediterranean (Messinian salinity crisis, 5.5 million years ago).


Evolución topográfica de la Cuenca del Ebro

[Este post hace divulgación de un trabajo que acabamos de publicar en Geology
[This is outreach material about our own research, now published in Geology

Viajando entre Navarra y Lleida habrás reparado seguramente en las capas casi horizontales de sedimento, omnipresentes en la Cuenca del Ebro. Se trata de sedimento depositado en el fondo de lagos y en ríos durante el Mioceno (hace entre 24 y 5 millones de años), proveniente de la erosión del Pirineo y, en menor medida, del Sistema Ibérico y la Cordillera Costero-Catalana.

1. Vista desde la cima de San Caprasio (Zaragoza), en el centro de la Cuenca del Ebro (cubierta por las nubes). A la derecha aparecen los sedimentos calcáreos más modernos preservados en la cuenca, datados en 13.6 millones de años. Foto: DGC.
2. Bardenas Reales (Navarra). Foto: PN Bardenas.
Soft alluvial clays interbedded with harder lacustrine limestones and fluvial sandstones predominate over much of the Ebro Basin in NE Spain. In these badlands at Bardenas Reales (Castildetierra, Navarra), high erosion rates have been measured in the order of millimeters per year, but how these rates link to the long-term history of the basin is unclear. These strata record a 15-million-years-old lake and alluvial system in the centre of an endorheic Ebro basin (84,000 km2 in area). Subsequent basin capture and drainage integration towards the Mediterranean lead to erosional features like the one in the picture. Our study dates this major drainage change at 12.0-7.5 million years ago. Location: 42.2103 N, 1.5157 W
3. La roca calcárea en lo alto del
Cabezo de Castildetierra (Bardenas 
Reales, Navarra) apenas protege a 
las margas de la erosión. Esas calizas 
se formaron en los lagos que ocupaban 
la Cuenca del Ebro hace entre 36 y 10 
millones de años. Foto: Carlos Sancho

Ese sedimento contiene importantes cantidades de yeso recristalizado (CaSO4·2H2O, Imagen 4), proveniente de la disolución de yesos más antiguos en el Pirineo. La acumulación de estas rocas evaporíticas indica que ese antiguo sistema de lagos del centro de la cuenca carecía de desaguadero, es decir, era un sistema endorreico en el que todo el agua recogida acababa siendo evaporada.

4. Yeso cristalizado visible en los niveles intermedios de San
Caprasio. Unos 18 millones de años de edad. Foto: DGC 
Tras ese largo periodo endorreico, el sistema lacustre rebosó o resultó colmatado de sedimento, formándose el actual río Ebro, que ha erosionado y transportado al delta más de 30,000 km3 del antiguo relleno de la Cuenca del Ebro. Hoy, el sedimento preservado más elevado está precisamente en la zona central de la misma, en la Sierra de Alcubierre, 20 km al este de Zaragoza y a 840 m sobre el nivel del mar (Imagen 1).
¿Porqué están más altos esos sedimentos en el centro de la cuenca, si los lagos deberían ocupar la zona topográficamente más baja? ¿Y porqué no rebosaron antes los lagos hacia el Mediterráneo, si la actual divisoria de la cordillera Costero-Catalana tiene lugares de menos de 500 m de altitud?

En ausencia de deformación tectónica (las cadenas montañosas circundantes ya se habían acabado de formar), los movimientos verticales de la superficie de la Tierra están generalmente relacionados con la isostasia: La erosión de la cuenca del Ebro supuso una descarga y un levantamiento (un rebote isostático) de la litosfera terrestre, que descansa sobre el manto como si se tratara de un iceberg en el océano.
5. Hundimiento isostático que sufre la litosfera (en gris) sobre la
astenosfera fluida (blanco) cuando sobre ella descansa una carga (verde),
para 4 escenarios en los que la litosfera es progresivamente más delgada y débil.
En el escenario de una litosfera muy gruesa y rígida no se producen movimientos verticales
de reajuste. En el caso más débil, cada columna del sistema se reajusta localmente y
tiene el mismo peso si se mide hasta un nivel de compensación en la astenosfera. Autor: DGC
En nuestro artículo de esta semana, hemos calculado estos movimientos verticales de la litosfera terrestre para poder estimar el volumen de sedimento erosionado que falta en la cuenca del Ebro. Comparándolo con el volumen actualmente acumulado en el delta del Ebro, hemos podido establecer la edad en la que se produjo la colmatación, el relleno máximo de la cuenca, entre 7.5 y 12.0 millones de años, así como la altitud original que alcanzó la cuenca: 535–750 m sobre el nivel actual del mar.
6. Animation (reload page if necessary): Estimated topographic evolution of the Ebro Basin (NE, Spain) since 10 million years ago until present


7. Las cuencas endorreicas (zonas que no drenan sus aguas al mar) suelen presentar sistemas lacustres que son extremadamente sensibles a las variaciones climáticas, pues en ellos la superficie lacustre se debe adaptar para compensar la lluvia recogida con la evaporación en su superficie.

2015-03-26

Microblogs will not become a source of scientific knowledge

This is the contribution I submitted to the newly created Journal of Brief Ideas, which defines itself as a research journal exclusively for articles of 200 words or less: 
Title: Microblogs will not become a source of scientific knowledge
The hypothesis that scientific knowledge can grow out of clearly-written ideas capsuled in 200 words with no antecedents, no references, no methods, and no results, is contradictory with the notion of science itself and therefore does not need to be refuted. However, the profusion of microblogging social networks that may be tempted to introduce DOI's as a way to make their tweets and posts citable, threatens to blur the boundaries with other sources of knowledge. Here, I expose the following brief ideas: 1) that any useful contribution to discern ideas that work from ideas that don't, will need, also in the future, enough words to describe how those ideas were tested; 2) that the routine activity of both scientists and non-scientists will tend to keep discerning the systematic, reproducible studies from bar conversations, online forums, and magically-revealed knowledge; and 3) that consequently the present brief, unreferenced publication will get no credit, even if it turns out to be the first to correctly predict the fail of short unreferenced notes as a source of scientific knowledge. And yet, my last 20 available words call for further transgressive ideas for this field, scientific publishing, that will be hardly recognisable in a decade.

Sadly enough, the editors have not accepted this 'article' for their 'beta journal', on the basis of a lack of a scientific advance in the field:
And I fully agree with their point. All they will attract is ideas, hypotheses, opinions; Scientific advance is much more than that and it will not be achieved in the format proposed. And to be consistent, the Journal of Brief Ideas should either ban most of the contributions they receive (like this) or stop calling itself a scientific journal. It is the reputation of the scientific method (slippery as this can be) that is at risk.

2015-03-25

Wiki Loves Earth 2015: Wikipedia, Geociencia y Biología


[Viernes 24 de abril de 2015, conferencia sobre este tema en Barcelona]

Wikimedia (la fundación que da soporte a Wikipedia y sus proyectos hermanos) está organizando el concurso internacional de fotografía Wiki Loves Earth, que premiará las mejores fotografías de espacios naturales catalogados con el fin de ilustrar artículos de Wikipedia y quedar disponibles en la red para su uso gratuito. El concurso nació en Ucrania en 2013, inspirado por el éxito de Wiki Loves Monuments (el mayor concurso fotográfico de la historia), y actualmente está organizado por las representaciones locales de Wikimedia (Wikimedia-España, Wikimedia-Argentina, etc) en más de 20 países, pudiéndose participar de forma gratuita. En España, los lugares fotografiados deben ser espacios naturales reconocidos como Lugares de Importancia Comunitaria por la red Natura 2000. Las fotografías no tienen porqué ser recientes, pero se deben presentar entre el 1 y el 31 de mayo de 2015. Para participar, basta con registrarse gratuitamente en Wikimedia Commons o en el grupo de Flickr creado al efecto y subir las fotos que quedarán públicamente accesibles e indexadas bajo una licencia libre. En cada país, un jurado compuesto por personas relacionadas con la naturaleza, la fotografía y el conocimiento libre otorgará varios premios, y las diez mejores fotografías de cada país participarán en la fase internacional del concurso, con sus propios premios. Para facilitar la localización de los Lugares de Importancia Comunitaria Wikimedia España ha creado listados de los mismos en cada comunidad autónoma, cada una de ellas con un mapa propio.
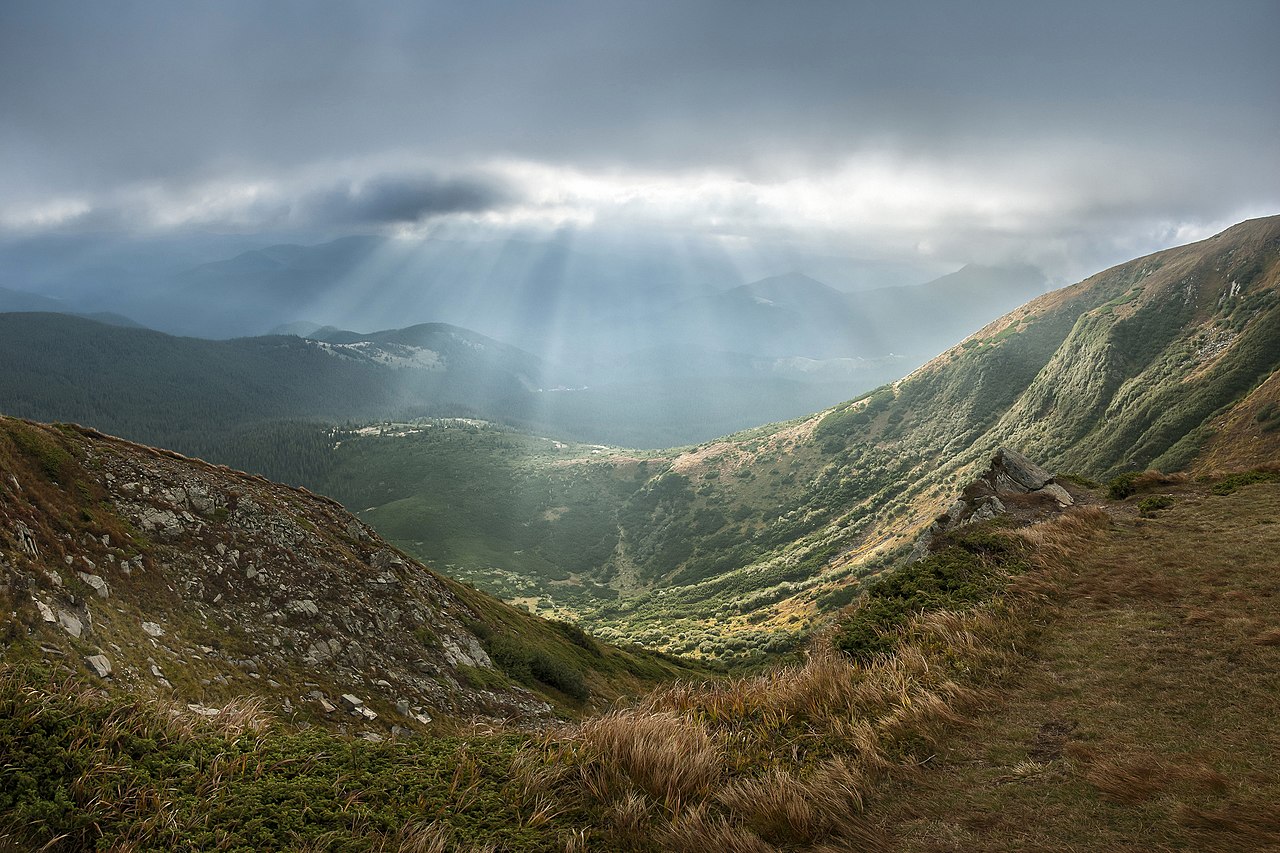
Fotografía ganadora a nivel internacional en la edición de 2014 de Wiki Loves Earth. Parque Nacional de los Cárpatos, ubicado en el monte Goverla. Ivano-Frankivsk Oblast, Ucrania. Por Balkhovitin (CC-BY-SA 3.0).
¿Y qué tiene que ver esto con la Tierra Sólida, la geociencia o la biología? Pues ésta puede ser una oportunidad para difundir el trabajo de campo que llevamos a cabo los geocientíficos (y biólogos) de todas las disciplinas. Las innumerables fotografías de campo que producimos cada año son casi siempre libres de derechos de autor y bien georeferenciadas, y son a menudo de calidad y de lugares poco accesibles o poco accedidos. Publicando estas fotografías en un repositorio libre como Commons no sólo llenamos sus vacíos geográficos sino que además aumentamos la presencia de nuestras disciplinas y zonas de estudio en la enciclopedia. Wikipedia, y particularmente su versión en español, es pobre en artículos sobre geología y Ciencias de la Tierra. Por ejemplo, hay 6 veces más artículos buenos o destacados en la categoría Historia de España que en Ciencias de la Tierra. Ignoro si esto es la causa o un reflejo del flojo reconocimiento que hace nuestra comunidad científica a Wikipedia, ese proyecto que nació hace 14 años revolucionando para siempre la compilación y el acceso al conocimiento.

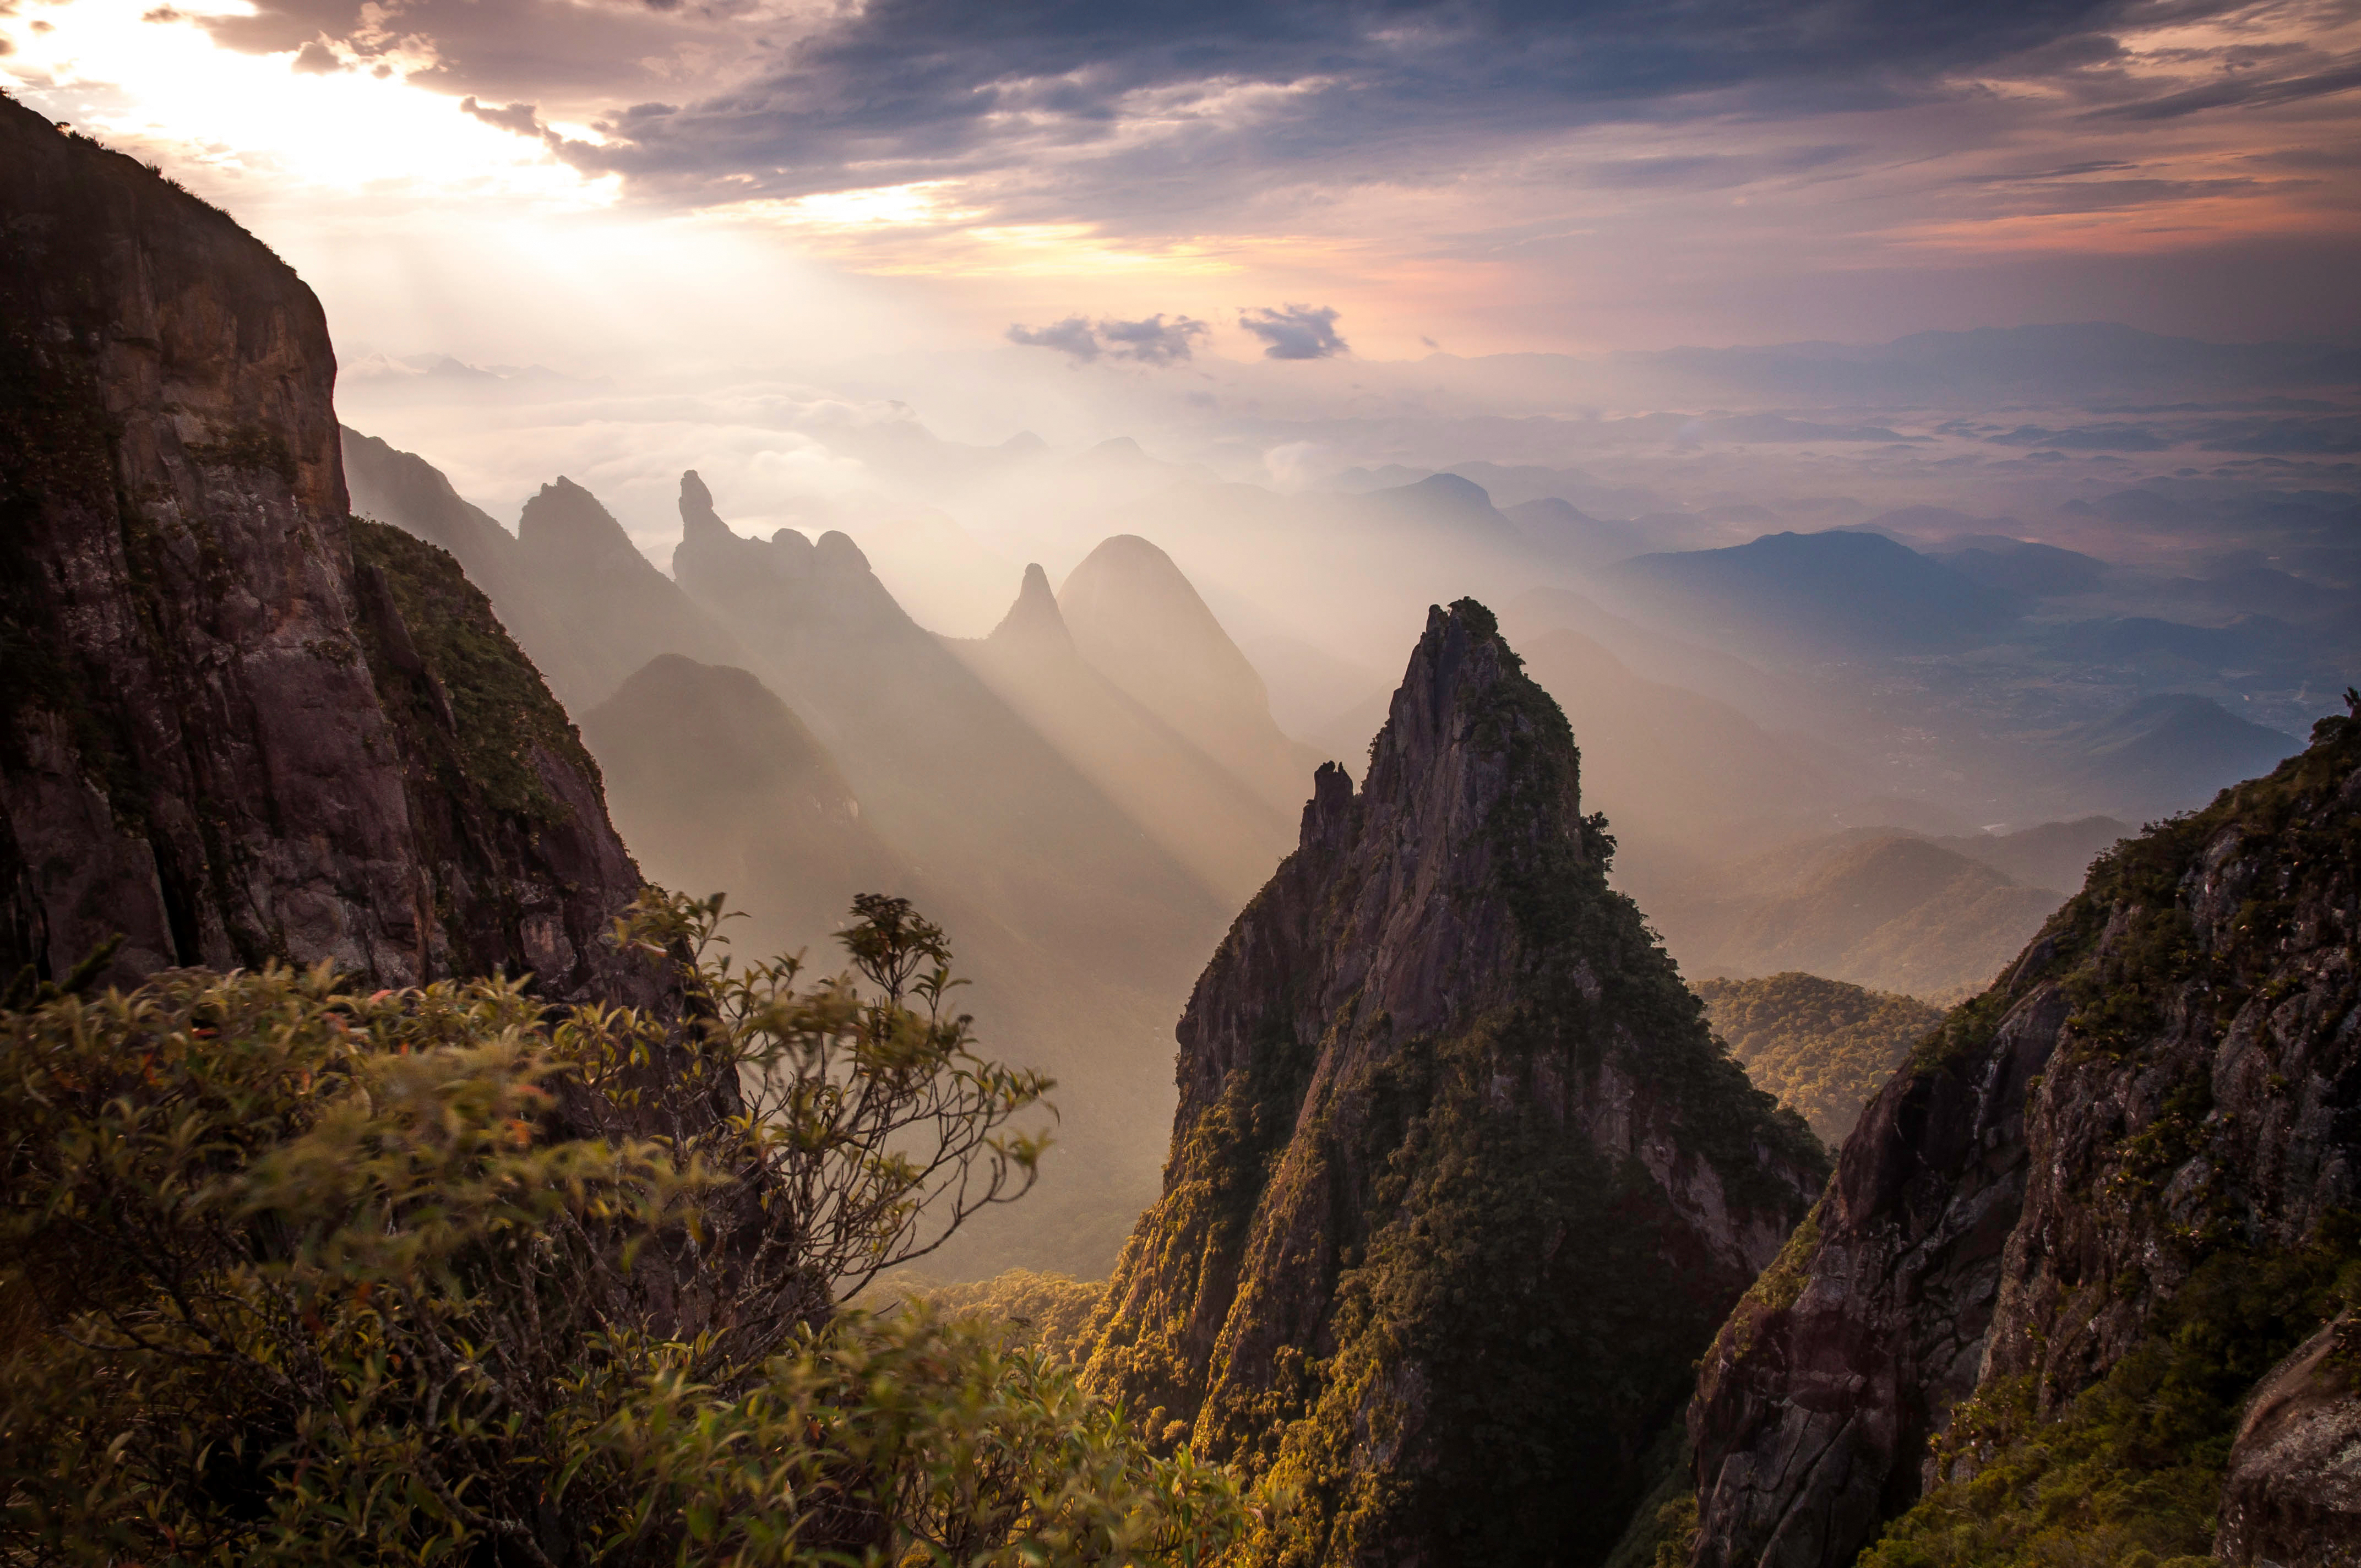
Segundo premio de 2014: Serra dos Órgãos, Estado de Rio de Janeiro, por by Carlos Perez Couto.


Wikipedia es una enciclopedia en la que cualquiera puede editar y supervisar los contenidos buscando el consenso con otros editores, todos voluntarios. Cuanto mayor es el número de editores atraído por un artículo, más discusión y más robustas son las mejoras. Como en ciencia, el éxito de una modificación de los contenidos depende a menudo de citar una fuente fiable; pero en cambio en Wikipedia importa poco si quien incorpora un cambio es una autoridad reconocida en la materia o un amateur muy entusiasta. Y a pesar de ello los contenidos no han parado de mejorar en calidad con el tiempo. Cuando Wikipedia nació en 2001 pocos apostaron por el futuro de una enciclopedia sin una editorial centralizada escogida arbitrariamente para producir los contenidos. Hoy Wikipedia está entre las 6 webs más consultadas del planeta, con alrededor de 28 millones de artículos de acceso gratuito sin publicidad, con más de 70.000 editores voluntarios activos (4.300 en español) que realizan 12 millones de ediciones cada mes, y hay estudios académicos que avalan la calidad de sus contenidos. Poner en duda el enorme impacto del movimiento wikipedista es hoy una osadía comparable a cuestionar la tectónica de placas.

Aparte de #WikiLovesEarth, existen otros proyectos que intentan fomentar la mejora de artículos sobre Ciencias de la Tierra (por cierto el Wikiproyecto está en peligro de caer inactivo), donde se pueden solicitar artículos que necesitan aún ser redactados o mejorados. O este Portal en el que se divulgan los objetivos de esta rama de la ciencia, y que cualquier amante de la misma puede mejorar haciendo click en 'editar'. También han habido multitud de proyectos educativos que usan la Wikipedia como base para dar a los alumnos claves de estructuración y evaluación crítica de la información. O para fomentar la interacción entre ciencia y humanidades: aprovecho para compartir esta experiencia personal.

Video sobre cómo participar en WLE:


Este artículo incluye extractos del artículo de Diego DelsoWikimedia España organiza por primera vez Wiki Loves Earth.

2015-02-20

Atlantropa, the Messinian salinity crisis, and other Alternative Worlds


Out of this age of crisis, a book has just been published that aims at fully opening the doors of imagination to show how audacious we humans are when in need to restart from scratch:

Alternative Worlds, Blue-Sky thinking since 1900 (R. Vidal & Cornils, eds.; Peter Lang Publishing, Bern, ISSN 3034317875, 9783034317870)

The book includes an article by the editor Ricarda Vidal (King’s College London) giving an updated perspective on the Atlantropa Project (1929). Atlantropa intended to reduce the area of the Mediterranean Sea by 30% by damming the Strait of Gibraltar, allowing natural evaporation to lower the sea level by a couple of hundred meters. With this project, Herman Sörgel sought to control the inflow of Atlantic seawater to generate electricity, to exposing new inhabitable land (former submarine continental shelf), and to use the Nile River to irrigate a vast part of the Sahara Desert.
The project thus aimed at mimicking what nature did 6 million years ago during the Messinian Salinity Crisis, and that's why I coauthor with Vidal a second chapter dealing with what we know about this ancient salinization and desiccation of the Mediterranean from a scientific perspective, and about the footprint this geology left in western culture.
The rest of the volume discusses fascinating Alternative Worlds including seasteads, planned cities, the high-rise age, and the promising worlds-to-be in the outer space.


Part I: Shaping the Earth and Sea
1. Ricarda Vidal: Atlantropa: One of the Missed Opportunities of the Future
2. Daniel Garcia-Castellanos/Ricarda Vidal: Alternative Mediterraneans Six Million Years Ago: A Model for the Future?
3. Philip E. Steinberg/Elizabeth A. Nyman/Mauro J. Caraccioli: Atlas Swam: Freedom, Capital and Floating Sovereignties in the Seasteading Vision

Part II: The 1960s – Building the Future
4. Patricia Silva McNeill: The Last ‘City of the Future’: Brasília and its Representation in Literature and Film
5. Elena Solomides: The Post-War High-Rise: Promise of an Alternative World
6. Christopher Daley: ‘The landscape is coded’: Visual Culture and the Alternative Worlds of J.G. Ballard’s Early Fiction

Part II: Alternative Lives
7. Maya Oppenheimer: Designed Surfaces and the Utopics of Rejuvenation
8. Boukje Cnossen: The Alternative World of Michel Houellebecq
9. Susanne Kord: From the American Myth to the American Dream: Alternative Worlds in Recent Hollywood Westerns
10. Marjolaine Ryley: Growing up in the New Age: A Journey into Wonderland?

Part IV: Outer Space
11. Peter Dickens: Alternative Worlds in the Cosmos
12. Ingo Cornils: Between Bauhaus and Bügeleisen: The Iconic Style of Raumpatrouille (1966)
13. Rachel Steward: Blue Sky Thinking in a Post-Astronautic Present.


  • Alternative Worlds, Blue-Sky thinking since 1900, R. Vidal & Cornils (Peter Lang Publishing, Bern, ISSN 3034317875, 9783034317870).
  • R.B. Cathcart, "What if We Lowered the Mediterranean Sea?", Speculations in Science and Technology, 8: 7-15 (1985).

2015-01-14

Scientist evaluation, the h index, and the #PaperBubble

[A bit of self-criticism on the science evaluation system, just to start the year.]

Wicked rules can pervert a community.
In science, the pioneer wicked rule was evaluating scientists for how much we published, how many papers we coauthored regardless of our real contribution to them, and in what journals do we publish, as a proxy for quality or merit. If you coauthor many articles in good (very cited) journals then you must be a good scientist, that was the institutional mantra. The basic underlaying assumption was that the citations to someone's work by other scientists are a good measure of the importance of her/his research, and I will not question this here. But in this century, to measure the importance of someone's work, we don't need impact factors anymore and we don't need to care about what journal hosts the article in question, because individual citations to each individual article are accessible in a few clicks.
Evaluating by the “mere number of a researcher’s publications” disincentivized risky and potentially-ground-breaking research lacking a short-term publication outcome, as the editor of Science argues. But this is what was being done. And as a result, the scientific articles published every year have nearly tripled since 1990.
Cumulative number of papers
published in Biomedicine
(source: PubMed via this)

The same has happened in most countries and in most disciplines, although some have moved much faster than the average, look :-)
Annual number of papers in Yoga studies over time.

Does this mean that our science is now three times better? Does it mean that our understanding of Nature grows 3 times faster than 25 years ago? 10 times, in the case of Yoga? Mmm. It does mean that now we can only track a small fraction of all the papers that are relevant to our research. 

[By Zhou Tao/Shanghai Daily] 

Needless to say, this has yet another additional price for all of us:

To compensate for the perversion inherent to this article-count approach, evaluators started weighting that number with something called Journal Impact Factor, assuming that articles published in highly cited journals have a higher, statistically-sound chance to have an impact. Perfect plot for a self-accomplishing prophecy; The warnings against this practice are a clamor.


Then citation databases went online and another wicked parameter came on the scene:
h, the Hirsch index, was adopted in the last decade to come over the number of publications criterion. It has now become a commonplace in the evaluation of proposals. But h keeps overvaluing multi-authored papers beyond reason, because it disregards the number of authors and their relative contribution (in most research areas, the relative scientific contribution of the authors of a paper can be approximated in first approach by the position in the author list). The citations to an article of yours count equally if you are the 1st author or the 100th. Therefore, a paper with 100 authors has 100 times more impact on the evaluation system that a single-authored paper. And I'm not being rhetorical here. Please, meet two of the highest-scientists in Spain (just an example):
Profile 1: 61k citations, 137 papers in 2013 only, h=112.
Profile 2: 117k citations, 164 papers in 2013 only, h=75.
I leave it to you finding the flaw.

Say you are part of a group of 100 friends, each leading his/her own paper and incorporating the other 99 as coauthors. Each citation to any of those 100 papers will reward 100 more people than citing a lonely author. Imagine now that each of them cites each other's paper. They immediately obtain 100 citations per paper. Not bad. It may seem this is a problem with self-citation that can be filtered easily, but it goes far beyond that. The 100 will still be rewarded beyond reason even if their citations come from someone else. Imagine that another group of 100 authors cites all your 100 papers as well as the lonely author's paper. This will give 100 citations to the single author but 10,000 citations to all others. Note that, if this were the first articles for all of them, then the single author would now be h=1, while all other have been miraculously promoted to h=100. 

This problem could be easily solved by weighting each author by 1/2^i , where i is the position of each author in the list. Because


, the weight of all papers would be equal in the citation system. For this, the remainder of the series must be given to the last author, which in practice implies that the last 2 authors get the same credit. Definitely, much fairer than giving all authors a weight of one.

But this was not done. Seemingly, decision makers were not interested in implementing anything like that.

Very predictably, the number of authors per paper just rocketed, and former research groups have often become author pools, with the entire group signing every paper published by each of its members. A symptom of this is that few researchers dare to publish on their own today:
Average number of authors per paper during the
last 100 years.
Source: PubMed
% of single-authored papers
over the last century. 


Papers published per year. Source

The left bar indicates the average number of
articles published by authors that stopped
publishing 15 years after their first publication.
The blue bar on the right shows the articles
published in the same timespan but by
researchers that continued publishing after 15
years. The red bar on top indicates the articles of
those same researchers after the 15th year. One
can see that the researchers that continue
publishing are those having a high research
output. It also shows that the research output
before the year break is the portion that
contributes most to the overall values. Source


So the drive to scientific publication is still based on quantity, not quality.


Ask any editor how many of their requests to review a manuscript are refused by peers, and you'll learn that they often end up doing the reviews themselves. Too many papers for such few reviewers/authors. It is unsurprising that you find funny bugs like this in articles that were supposed to have been reviewed.


It is difficult to find objective (quantitative) criteria for quality. And perhaps it is also time to question the trust on objective parameters. Alternatives such as interpreting the subjective impact foreseen for a given research are also risky. But if the citation criterion is to be adopted, then we do not need h-like indexes or journal impact factorsThere are better metrics proposed (examples), they just need to be adopted. Metrics accounting for the author order and the number of coauthors.

Under the present rules, young researchers are pressed to publish as much as possible instead of publishing as good as possible, not only perverting the research system but also inflating a huge publication bubble. The warning lights are long on. China has already realized the problem and may be soon taking action. Why not Europe? Will we wait until this bubble bursts?

Wicked rules pervert communities, so let's just adopt better rules. In 10 years the science publishing panorama will be unrecognizable anyway.

Source: Science Mag


PD: Interesting discussion in the comment section of this column in last week's Nature.

PD2: Ironically, a journal called Bubble Science just went closed earlier this year.

PD3: A new metric proposed: Author Impact Factor: tracking the individual scientific impact, by Kumar Pan & Fortunato. link

PD4: A new journal now allows publishing citable articles of less than 200 words with a DOI. What next? Citable tweets?

PD5: A paper reinventing the trapezoidal rule https://t.co/CANpYZ8GkX published in high-impact journal & has 268 citations pic.twitter.com/ECI04VaoQ3 — ∆ Garcia-Castellanos (@danigeos) January 28, 2016

PD6: A PosOne paper by V. Vavryčuk including some references on this: "Fair ranking of researchers and research teams" https://dx.plos.org/10.1371/journal.pone.0195509.

PD2022: China is now the first country by number of peer review publications as well as by most-cited articles. Thousands of scientists publish a paper every 5 days and the number of such authors has multiplied by 20 over 15 years.