Pages

Featured Post:

2012-09-10

Watch the Lithosphere moving up and down

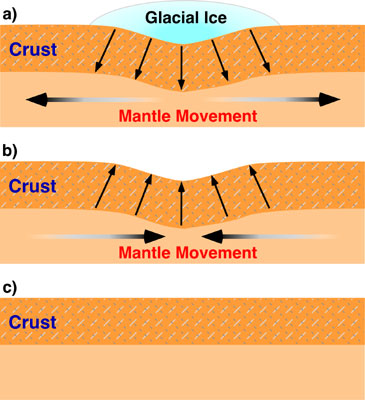
The lithosphere, the uppermost resistent layer of the Earth, rests on the fluid mantle underneath and moves up (or down) in response to weight removed from its surface (or placed on it), such as ice capes, large lakes, mountain ranges, volcanos...  
Isostatic sinking (subsidence) and
rebound (uplift) occurring when an
ice sheet forms by climate cooling
and when it is removed by climate warming.
The downwarping (isostatic subsidence)
produced by the ice accumulation in a) is
fully recovered in this process (b and c). 
My first steps into geoscience dealt with this concept called isostasy, which looked somewhat simple to a recent graduate in Physics as I was back then, since it simply applies the Archimedes Principle to the Earth's lithosphere. But this idea was just emerging in the late 19th century. And still, G.K. Gilbert was there to get it and to apply it to one of its most conspicuous scenariosLake Bonneville. 

Lake Bonneville was an enormous closed lake (meaning it had no outlet) encompassing the western half of Utah during the Pleistocene. The Great Salt Lake is a small remnant. It would be among the few largest, deepest, and highest lakes today. When its level raised to 1500 m above sea level at the end of the last glaciation, 15,000 years ago, its waters found an exit through the Red Rock pass and the lake was suddenly drained. It produced one of the largest floods ever recorded: the Bonneville Flood (see this previous post). But there was another consequence to the flood: When the lake water was released, the lithosphere under the lake moved upwards to readjust its isostatic equilibrium with the viscous mantle that underlies the Earth's crust. 

Now, do you believe this story?

2012-09-02

La otra gran crisis Mediterránea (la del Messiniense)

Si hoy se construyera una barrera en el estrecho de Gibraltar, el Mediterráneo descendería de nivel casi un metro cada año, debido a que recibe menos agua de los ríos y la lluvia que la que evapora en su superficie. Por inverosímil que parezca, un arquitecto alemán estuvo cerca de poner en práctica esta idea en 1929: Herman Sörgel planeó la construcción de un inmenso dique en Gibraltar con el dudoso objetivo filantrópico de unir Europa y África secando el Mar Mediterráneo: se trata del Proyecto Atlántropa.
Flujo de agua superficial (flechas blancas) y profundo (flechas oscuras)
en el Mediterráneo durante 11 meses de 2005-2006. Se puede distinguir la 
doble corriente en el Estrecho de Gibraltar.

2012-07-25

Large Pleistocene Floods along the Columbia River

ResearchBlogging.orgI spent the last weeks travelling through Idaho, Montana, Washington, and Oregon, tracking evidence for the floods that shaped the landscape of the US Pacific Northwest. For most of it I was privileged to be guided by Jim O'Connor (USGS, Portland), world-class specialist in these events (sample references below). The pictures of this geological trip show erosional and depositional features produced by outburst floods during the Pleistocene, including the Missoula ice-dam collapse and the Bonneville flood. 
Snake River gorge cutting the
Flood Basalt layers, through which
the Bonneville flood discharged. Looking downstream. Foto: DGC
Detail of the boulder field in the center of previous figure. Looking upstream. Foto: DGC

One thing that makes this scenario key to understand the importance of large flooding events in shaping landscape is the ubiquitous Columbia River Basalt formation (one of the largest flood basalt regions) and the Yellostone-Snake River volcanic zone. Both covered many of the areas we visited with a nearly flat layer of very fluid basalt, during the Neogene, long before the Pleistocene floods (see e.g. Fouch, Geology, 2011). The simple relief and lithological setting left by the flood basalts enhances the erosional features related to the Pleistocene water floods and the presence of vertical tectonic motions. 

2012-07-19

Porqué sin ciencia no habrá economía


Al parecer, en España se podrían cerrar pronto centros de investigación, con toda su plantilla. Lo que ya es una realidad es que el CSIC acaba de anunciar la suspensión del pago de costes de proyecto debido al retraso en los ingresos que recibe del estado (otro artículo aquí). Eso significa que se para la investigación en los 136 centros del CSIC. No podemos pagar la publicación de un artículo, ni asistir a congresos, ni pagar gasolina para estudios de campo, ni comprar un reactivo para un experimento, a menos que lo pague el investigador de su bolsillo (y sucede, creedme). Esta situación endurece la tendencia que dura ya tres años.

¿Cómo va esto a hipotecar la economía de la próxima generación? Se ha explicado muchas veces, pero voy a poner otro breve ejemplo semi-ficticio:

2012-07-17

Outstanding Open Questions in Geoscience - a draft

Visit the Updated version of this old draft.

ResearchBlogging.org
[The following list responds to personal curiosity about open scientific questions that keep Earth-science researchers busy across disciplines. This is probably biased towards what has been my own field and towards Solid Earth in generalNote that this list is based on a personal draft, then completed with former studies found elsewhere (e.g., Science 125th anniv., or the NAS report Origin and evolution of Earth [pdf] [html], or this other NAS report on surface processes), and then with further ideas that came through Twitter, discussions, and from this earlier blog post (thank you all contributors!). I grouped and selected them arbitrarily following my own biased personal judgement. The references may not always be the best representative.]
Suggestions are very welcome. If you feel your field is extremely exciting but not represented here, please leave your comments below or send them via Twitter to @danigeos.


Visit the Updated version of this old draft.

Visit the Updated version of this old draft.

2012-05-08

How to dig a submarine canyon with no net erosion

Submarine canyons are deep valleys through which sediments eroded from the continents are delivered to the deep ocean, across the continental margins and slopes. One prominent example is the Monterrey Canyon (pdf poster).


They are often regarded as the result of erosion produced by the submarine flow, but this is what we just found in seismic data from the Ebro delta (published last week in Geology, link to abstract):


2012-05-07

Cómo reconocer la buena ciencia en la red

[Ésta es una versión extendida del artículo original para Amazings]

La ciencia avanza A Hombros de Gigantes, decía 
Chartres ya en el siglo XII: 
los descubrimientos se basan y se suman 
a los que nos transmitieron generaciones 
anteriores, y sólo gracias a lo que nos 
transmitieron podemos ver más allá. [Fuente]. 
ResearchBlogging.org
En la red y en los medios tradicionales abundan las menciones a estudios científicos que no lo son. Los magufos (definición) están incluídos en ese grupo, pero en la prensa se citan infinidad de trabajos cuya acientificidad es más sutil. La geociencia es especialmente vulnerable a este tema (quizá or motivos históricos, p.e., Alvarez y Leitao, 2012, Geology). Recordad si no el grito de "Geology is not a true science!" de Sheldon en Big Bang Theory. Bromas aparte, me arremango para explicar los ingredientes para mí más importantes de un buen artículo periodístico sobre ciencia, sea amateur o profesional:

¿Cita fuentes? ¿Menciona estudios previos?
En la web, los malos artículos sobre ciencia se delatan por carecer de enlaces a las fuentes originales, fuentes fiables e independientes que apoyen lo que cuentan; igual que en ciencia o en Wikipedia, la clave de un buen artículo es la calidad de sus referencias. Un artículo periodístico tiene que dar alguna pista de qué se había hecho ya antes de ese trabajo que intenta comunicar. La ciencia no es más que un sistema de recopilación, extensión y comunicación del conocimiento: cualquier nuevo estudio debe partir de resultados anteriores. Por eso el extracto de sauce blanco usado medicinalmente en la América precolombina pudo ser un conocimiento extraordinariamente útil, pero no científico: sus propiedades no habían sido relacionadas cuantitativa ni sistemáticamente con otros conocimientos de la época. En cambio el descubrimiento de su principio activo y el aislamiento del ácido acetilsalicílico (aspirina) sí lo son. Cualquier estudio científico tiene que partir de lo que ya se ha descrito antes, debe anclarse en el conocimiento científico existente. Eso es una pesadez pero, como científico, demostrar que conoces lo que ya se ha hecho en tu campo es el primer paso para que tu estudio sea tomado en serio. Y el artículo periodístico debe reflejar este proceso. 

2012-04-16

3D scan in real time using Xbox Kinect

This is a real-time 3D scanning with Xbox Kinect at the beach in Oregon, by James Dietrich and Mark Fonstad. The device projects an infrared pattern (see this other video) and by looking at that pattern reflected on the real objects it calculates the distance for each pixel, in real time. In this case, I am the 'real object', besides the camera holder. This information allows the computer software to 3D rotate the object in the screen in real time (while the object moves, for instance), changing the perspective.
The potential applications for geoscience are... infinite! For example: no need to measure and count pebbles any more, you river geomorphologists, just a 2-second scan and there it comes your grain-size distribution!


And this is a group 3D-picture he took at the same Bretz Meeting in Oregon, last week:
http://youtu.be/s4B3O50q9nk
Amazing, ha? It's a 3D model based on a series of pictures taken with a normal camera.

Update:
Follow this link to learn more technical details about the device.

2012-03-22

Ideas on open questions in Earth Science?

[PD: The result of this initiative is in this later post]

Searching for Unknowns consumes most of our research time and also makes the bulk of our research motivation. Wouldn't it be good to share the biggest open questions in our respective disciplines? 

I'm working on a list of challenging and sound geoscientific questions being researched today. Geoscience is here taken in the wide sense, including climate, hydrology, planetary science, ecology, geology, geophysics, etc.
I'm thinking of specific problems that are well established from a scientific point of view and that have an impact on at least a couple of subdisciplines. Examples would be: "What caused the Permian extinction?" or "What drives magnetic polarity reversals?" or "How much of the current climate change is anthropogenic?". But a bit more of elaboration and a key reference would be desirable.
I will try to summarize the compiled ideas in a later entry in this blog, but key references discussing each subject are welcome. I'm looking forward for suggestions or feedback, either as comments to this post (below) or at @danigeos on Twitter.

Update:
Alexandra Witze shares links (in a comment below) to the following relevant documents: 1, 2. Some of the questions summarized there will be useful as a general frame to what i aim at (they are big trans-scientific goals). But I would like to find the top key questions at a more detailed level, more specific, even if of interest only to a minority of subfields within Earth Sciences. Open problems that most assistants to the AGU, EGU, GSA or INQUA meetings could be curious about even if only a small percentage could really judge critically.

Update 2:
A reference to a key paper on the problem proposed will make every contribution much more valuable!

Update 3:
The result of this initiative is in this later post:

2012-03-15

Seafloor spreading, magnetic reversals, and plate tectonics

Doing science consists of formulating refutable hypotheses, this is, new interpretations based on former experience that lead to predictions that can be either confirmed or falsified (by future research).

Timing of the last reversals of the Earth's
magnetic field. Time goes from 5 Million 
years ago (bottom) to present (top).
Periods in black match today's polarity;
periods in white underwent reversed polarity. 
Source: Wikimedia Commons. A more complete scale here.
A case history in Earth science is the confirmation of the plate tectonics theory during the 60's. Back in 1912, this theory was just a hypothesis known as continental drift and put forward most remarkably by Alfred Wegener, based on observations of the fossil fauna matching across different continents. Well, in addition to the matching coastlines of continents pointed out by Abraham Ortelius as early as in the... 16th century!

One implication of the continental drift idea was that the oceans laying between continents that drifted away from each other should have gradually spread apart. This is known as the seafloor spreading hypothesis. But how to prove it?

Much earlier than that, the Earth's magnetic field had been studied scientifically since the beginning of the Spanish and Portuguese explorations of the Americas (Alvarez & Leitao, 2010, Geology, The neglected early history of geoscience). By the 17th century, maritime trading was dependent on the accurate mapping of magnetic intensity across the Atlantic Ocean. These studies culminated by the 19th century during the so-called Magnetic Crusade, leading to the realisation that the magnetic poles migrate significantly over historical time periods. And in fact, these rapid changes of the magnetic field soon became one of the theories proposed to explain why the magnetic orientation recorded in rocks depends on their geological age.

North Magnetic pole wander from 1590 to 2015. Click on the pins to see the year. From the GUFM and IGRF models. Via NOAA.

Today we know that historical magnetic changes are normal in periods of stable magnetic polarity, and that although the polarity flips recorded in rocks take just a few thousand years, they occur only over geological time-scales (millions of years).
Computer model based on Glatzmaier & Roberts. Magnetic field lines are in blue
when the field points towards the center and yellow when pointing away from it. The
rotation axis of the Earth is centered and vertical. The dense clusters of lines are
within the Earth's core

Back in 1957, Marie Tharp found enigmatic alignments in the shape of the seafloor around the center of the Atlantic Ocean, roughly where seismicity was being detected. In 1963, both the geophysicist Frederick J. Vine and the geologist Lawrence W. Morley independently realized that if the seafloor spreading theory was correct, then the rocks surrounding mid-oceanic ridges should show symmetric patterns of magnetization reversals, recording the changes of the Earth's magnetic field in the volcanic rocks at the time when these erupted and cooled down at the mid-ocean ridges. This is  now known as the Vine–Matthews–Morley hypothesis, and became a validation test for the seafloor spreading, and for the plate tectonics theory in general.

Seafloor spreading at a mid-ocean ridge, recording time-changes of geomagnetic 
field polarity. Source: Wikimedia Commons.
Morley's letters to Nature (February 1963) and to the Journal of Geophysical Research (April 1963) were both rejected, so Vine and his advisor Matthews were first to publish the hypothesis on the same year. The patterns of ancient reversals of the Earth's magnetic field have been found thereafter in hundreds of paleomagnetic surveys, providing a robust validation of their hypothesis. In fact, a vast later work of age calibration of these magnetic reversals allowed for the detailed maps of the age of the oceanic floor that we have nowadays:
Map of the age of the seafloor based on the reversal of the magnetic field
recorded in the oceanic crust during its formation at mid-oceanic ridges.
Red indicates a young seafloor, whereas blue is used for the oldest oceanic crust.
(Source: National Geophysical Data Center)

Magnetic reversals are still today one of the key methods allowing rock dating (don't miss the name for it: magnetochronostratigraphy). But we know very little about the mechanisms responsible for these magnetic field changes. Computer simulations suggest that it is a natural result of feedback forces between the magnetic field and the flow in the Earth's core (see the reference to Glatzmaiers' below), similar to dynamo going tilted by its own magnetic field. It has been recently shown in this article in GRL a correlation between the distribution of tectonic plates and the frequency of magnetic reversals over geological time ("geological intervals characterized by an asymmetrical distribution of the continents with respect to the equator are followed by intervals of high reversal frequency"), suggesting a mechanical coupling between both phenomena. But the specific mechanism behind magnetic reversals and the additional information they may contain about the interior and the past of our planet remain, so far, a challenge (yet another Reto Terrícola!).

Update (2015-09): A Science News article on a recent study on core convection and the magnetic field.


The origin of the Earth's magnetic field 
explained in 9 minutes.


References:

Vine, F., & Matthews, D. (1963). Magnetic Anomalies Over Oceanic Ridges Nature, 199 (4897), 947-949 DOI: 10.1038/199947a0

Pétrélis, F., Besse, J., & Valet, J. (2011). Plate tectonics may control geomagnetic reversal frequency Geophysical Research Letters, 38 (19) DOI: 10.1029/2011GL048784

Glatzmaiers, G., & Roberts, P. (1995). A three-dimensional self-consistent computer simulation of a geomagnetic field reversal Nature, 377 (6546), 203-209 DOI: 10.1038/377203a0

2012-02-20

Pakistan Tribune: Hunza landslide dam to be blasted on Feb. 27th

Maybe you were following the flood risk created 2 years ago by the Hunza Valley landslide in January 2010. There were fears that once the lake overflowed it would trigger a massive outburst flood (you can have a look at my previous post, focused on this phenomenon). More than 25,000 people in Gojal were stuck after the massive landslide formed a natural dam in the Hunza River, creating a lake that consumed upstream villages as it expanded. The landslide also blocked the Karakoram Highway, a vital trade link connecting the region to China.

Now there are news about that. According to the Tribune of Pakistan:
The spillways need to be blasted (...)The district administration of Hunza Nagar made an announcement last week to blast the spillway on February 18, but put off the task till the 27th of this month.(...)Explosives will be used to blast the boulders currently obstructing the outflow of water though a spillway dug in 2010. Several unsuccessful attempts have been made in the past using controlled blasting to widen the spillway.An official said that traffic on the Gilgit-Hunza portion of the Karakoram Highway would be stopped on that day. Authorities also warned residents settled downstream to avoid venturing to the riverside. Pakistan Red Crescent society (PRCS) has deputed a team of volunteers to assist the administration in case of an emergency.
Let's hope everything is done safely and that the blast serves to get knowledge on how do outburst floods develop.


[Via The Landslide Blog]


Update 2012-03-01: Level went down by 7m after works to enlarge the spillway and the reopening by blast last monday. Good news for people living downstream: pamirtimes.net
This has been probably helped by the erosion produced by the peak discharge reached, about 50,000 cusecs (1400 m3/s).

Update 2012-05-15: Another blast of the gravel dam: Pamir Times.

2012-02-17

Megafloods, gradualism, and the birth of geology

Altai Republic, southern Siberia, close to Mongolia. All the mountains around are older than 60 million years and we are about 300 m above the Chuja River. And yet we are stepping on recent (Pleistocene) gravels! These gravels are similar to those in every river bed except for their elevation above the river and for the fact that they show no apparent stratification: good indications that they were deposited in turbulent waters at that height, only 15 thousand years ago. The problem is: considering the valley width and the slope along the river in this area (~0.6%), such high water should have moved faster than 30 m/s, implying a discharge of about 100 times the present Amazon river. This event is getting to be known as the Altai Flood (+ info in this pdf).
No meteorological event could explain such a huge water discharge, particularly in a small catchment like that of the Chuja River. Instead, Russian geomorphologists came out during the 80's with this explanation: some tens of kilometers upstream (here), a glacier blocked the Chuja River for some thousands of years and formed a large lake behind. When the ice barrier collapsed, the sudden release of the lake's water produced a gigantic outburst flood with no historical precedent. This is today the most accepted interpretation of features such as the gravels laying along the flanks of the Katun valley (e.g., Herget, 2009).
This picture is taken from the top of the gravel deposits, nearly 300 m above today's river level. The gravels (note their size of a few cm) are interpreted to mark the upper reaches of the flooding waters when they encountered the hill obstacle and then ran up converting kinetic energy into potential energy. Location map. Other photos of this fieldtrip here.
But wait, doesn't all this sound a bit pre-geological? Religions often depict the Earth as being shaped by large floods and cataclysms following Creation. Is geology now acknowledging some truth in those myths? 

2012-02-15

Steady-state topography during orogenesis: Erosion vs. Tectonics competition

I uploaded to Youtube a simple but interesting numerical model. It computes a constant tectonic uplift with the competing river erosion along a cross section, allowing enough time to reach two successive topographic steady states (one during uplift, another one after uplift):
Steady state topography development, and other parameters of the model.
Uplift occurs between x=-50 and x=+50 km. The dashed line indicates 
the topographic profile that would develop in absence of erosion. 
Equilibrium topography is reached at ~4 and at ~8 Myr.

This is calculated assuming constant uplift rate at the center (x=-50 to +50 km) and a 1D stream power law erosion model. Uplift rate is 1 mm/yr and stops at t=5 Myr. River erosion is proportional to slope and water discharge. Precipitation rate is constant over the entire profile. Calculations are performed under Linux with the program tAo (Garcia-Castellanos, 2007, EPSL). +info and software download here: https://sites.google.com/site/daniggcc/software/tao

As you can see, topographic growth goes on until a first steady state (with a maximum topography of ~3000 m) is reached before 5 Myr. If you look at the numbers, you'll see an equilibrium between erosion rates and uplift rates at that time. At 5 Myr uplift stops and then erosion leads to the new equilibrium: a flat topography (at 8 Myr).

Now, the question is: does steady-state topography exist in nature? And if it does, can we recognize it? In real Earth, neither climate nor tectonics are constant through time. The questions are probably too big for this small blog, but you can find some hints in this article by Willett and Brandon (2001).

Nevertheless, the notion of steady-state topography is useful to understand some basic principles of orogenesis, as Whipple (2009) showed in a very simple and elegant way. Consider these two end-member types of orogen:

Evolution of for parameters (orogen width, erosion, topography, and rock uplift) for two simple models of orogenic growth. Left: fixed width orogen; Right: Self-similar growth. At t=0, the erosion coefficient is set to a double value (red) and to half of the reference value (green). Erosion is assumed proportional to elevation. The parameters are shown normalized. Redrawn from Whipple (2009).  
Assume both orogens grow in response to the convergence of two tectonic plates, producing a constant tectonic flow Fa, and that they are eroded at a rate proportional to elevation. The red lines in the figures above correspond to a change to double erosion efficiency. With such a simple representation, it becomes clear that if erosion mechanisms become more efficient, both orogen types initially undergo an increase in erosion rate, but this will gradually decrease back to the initial erosion value (the one compensating the imposed tectonic flow, as in the animation above). The way the orogen returns to the original low erosion rate is by decreasing its elevation R.
One interesting thing is that, whereas for a fixed width, rock uplift rates return to normal after some time, the self-similar growth predicts a permanent increase in uplift rates.
And the other interesting conclusion is that the time response is controlled mainly by the erosion efficiency itself (within the approaches of the model, of course).

Simple models are generally more inspiring than the most complex ones.

References:

Whipple, K. (2009). The influence of climate on the tectonic evolution of mountain belts Nature Geoscience, 2 (2), 97-104 DOI: 10.1038/ngeo413

Willett, S., and Brandon, M. (2001). On steady states in mountain belts Geology, 30, 175-178

2012-02-12

2011 update to global warming

[This post is basically excerpted from 2011 Updates to model-data comparisons, RealClimate, by gavin]

Curious about the global temperature trend after updating with last-years temperature record?

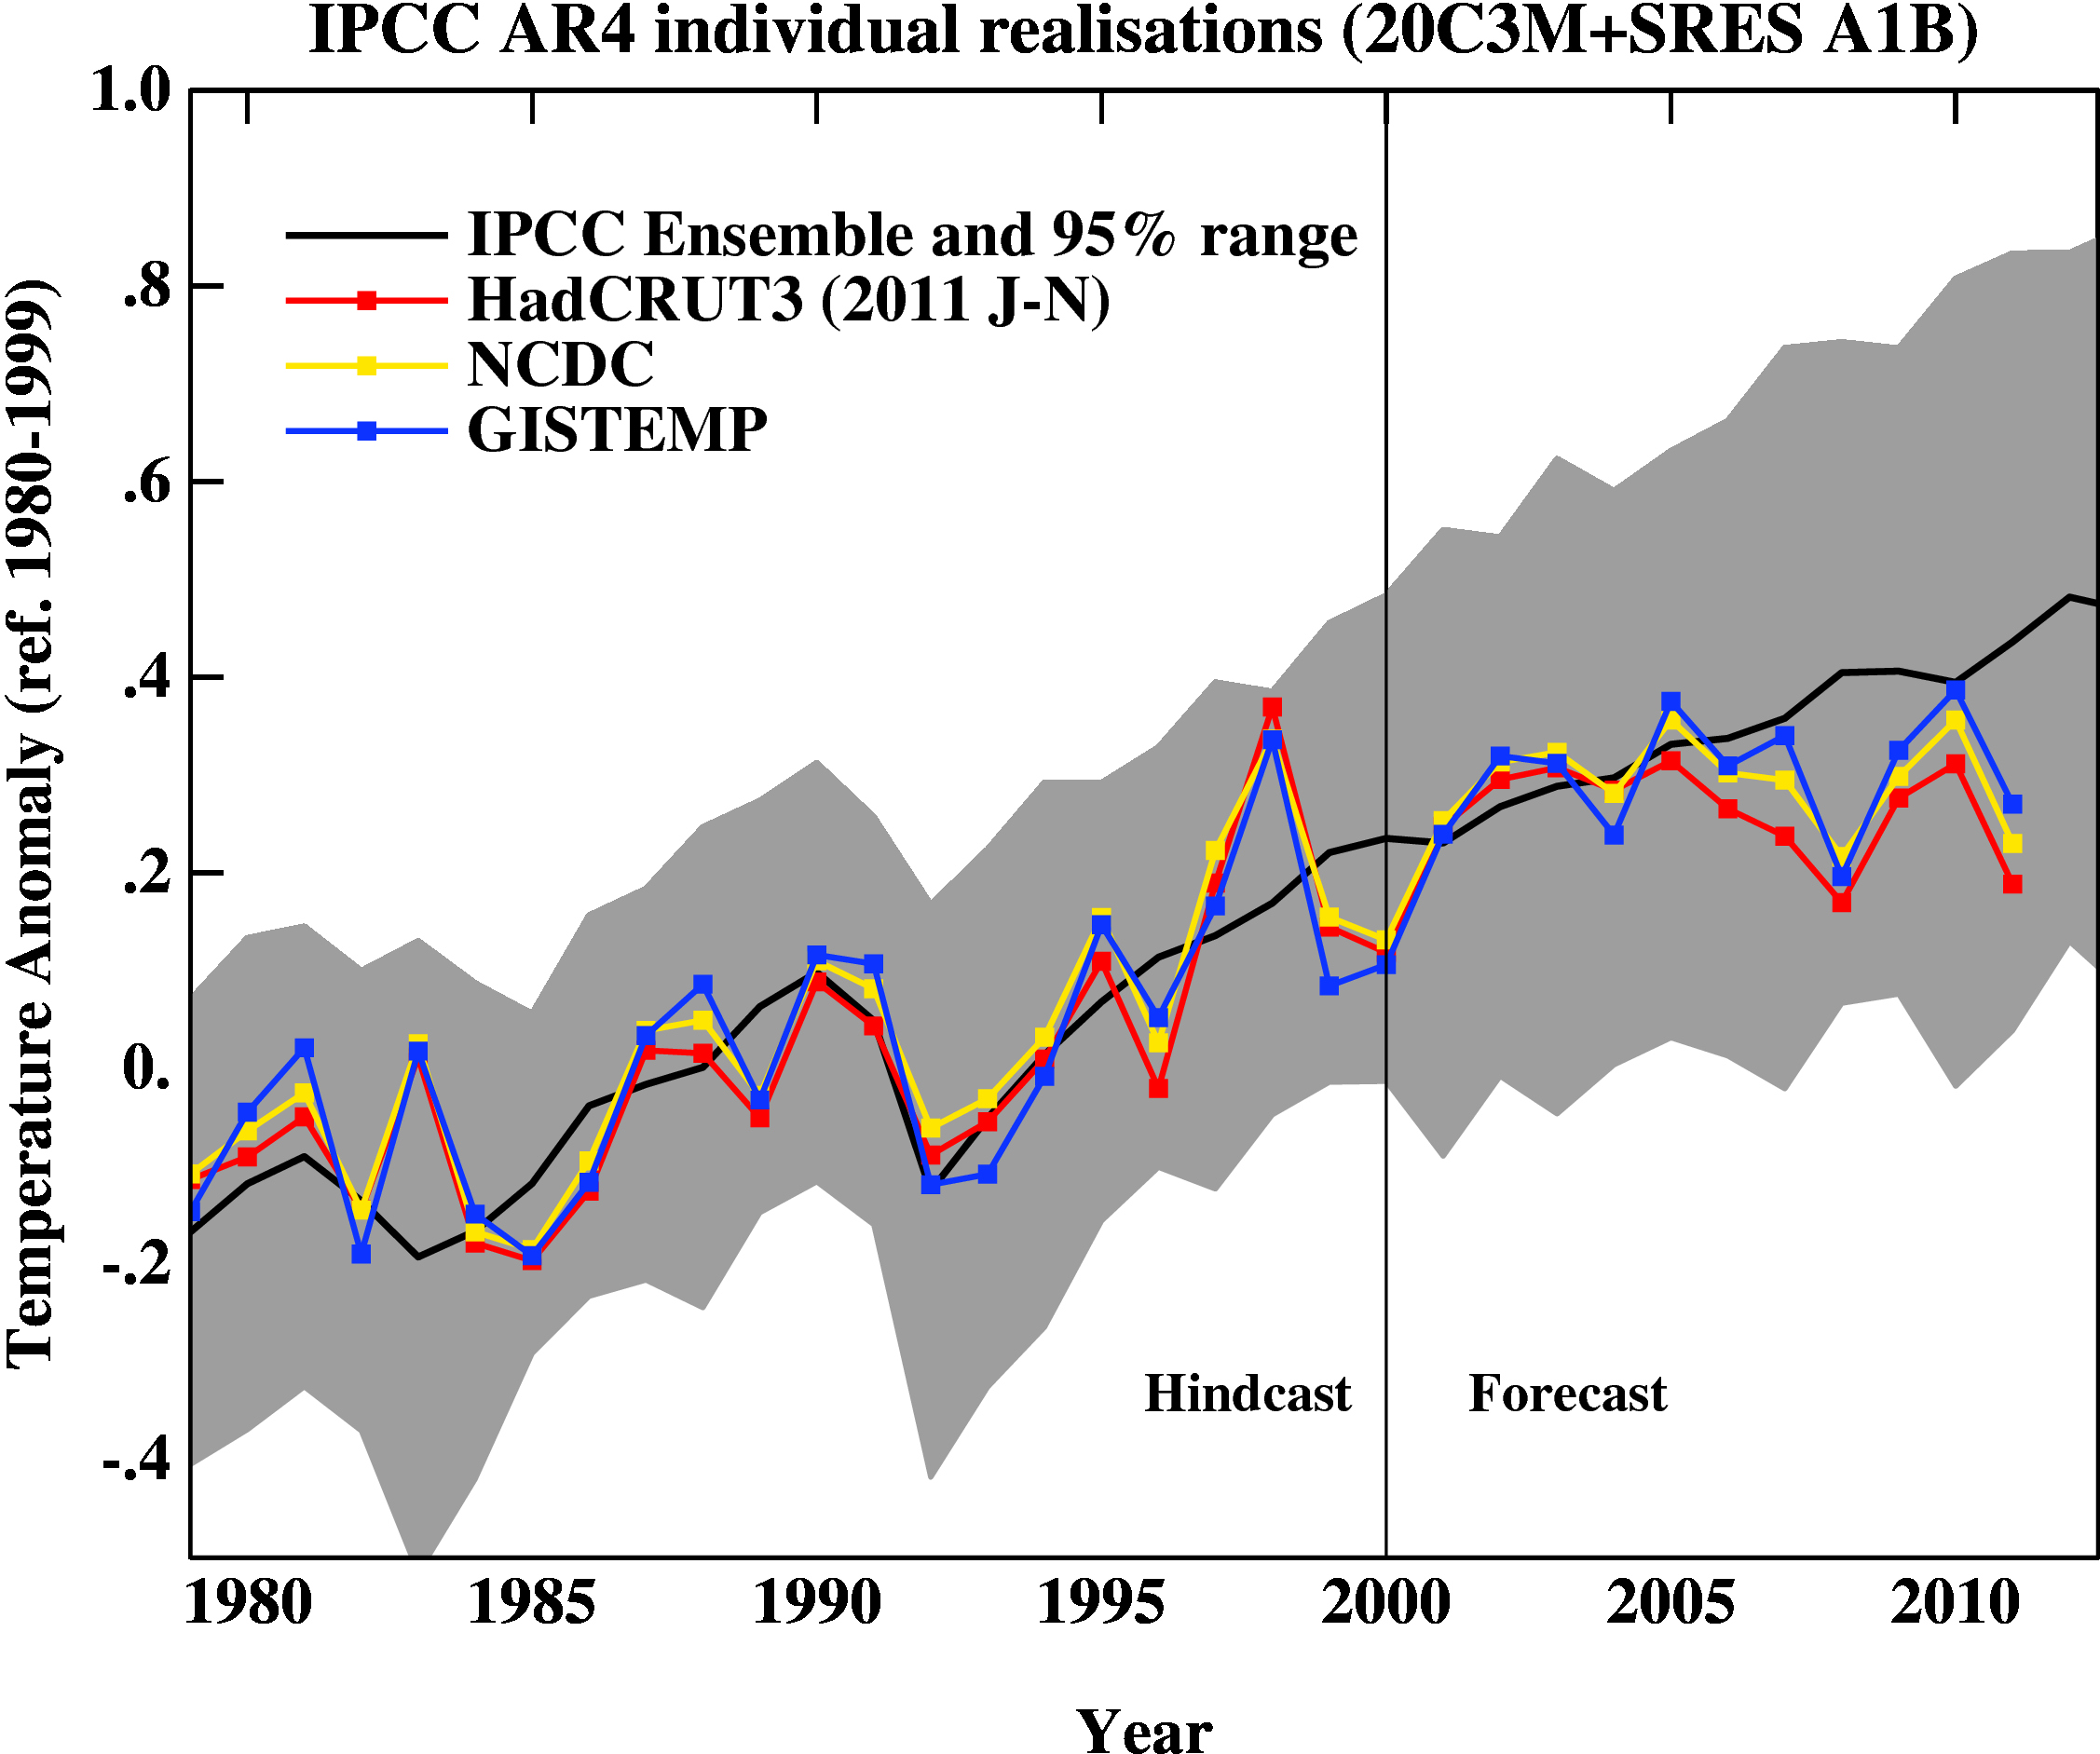
Mean-temperature rise since 1980
Mean anomalies from the IPCC AR4 models plotted on surface temperature records (HadCRUT3vNCDC and GISTEMP). Everything is baselined to 1980-1999 and the envelope in grey encloses 95% of the model runs.
The La Niña event in 2011 cooled the year relative to 2010. Differences between the observational records are mostly related to interpolations in the Arctic. Given current indications of only mild La Niña conditions, 2012 will likely be a warmer year than 2011, so again another top 10 year, but not a record breaker – that will have to wait until the next El Niño.

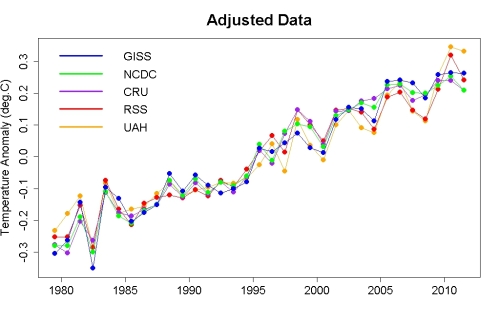
Corrected for short-term processes
Foster and Rahmstorf (2011) showed nicely that if you account for some of the obvious factors affecting the global mean temperature (such as El Niños/La Niñas, volcanoes etc.) there is a strong and continuing increasing trend. An update to that analysis using the latest data is available here.
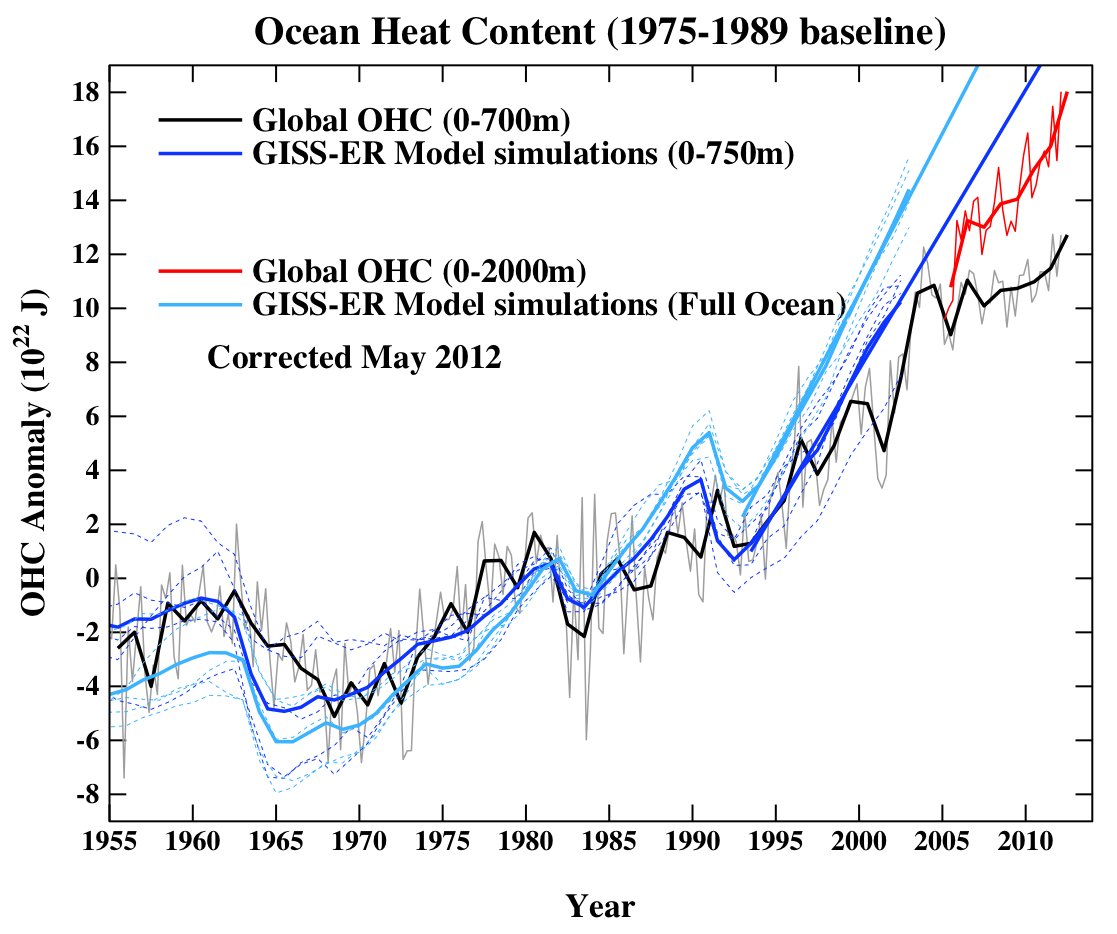
Ocean Heat Content
Ocean heat content (OHC) in the models compared to the latest data from NODC. All curves are baselined to the period 1975-1989.

Summer sea ice changes
Sea ice changes this year were dramatic, with the Arctic September minimum reaching record values (depending on the data product). Updating the Stroeve et al, 2007 analysis (courtesy of Marika Holland) using the NSIDC data we can see that the Arctic continues to melt faster than any of the AR4/CMIP3 models predicted.


2012-01-20

FAQ sobre la Crisis Salina del Messiniense (preguntas frecuentes)

Como en el último mes he tenido muchas preguntas sugerentes sobre la crisis salina del Messiniense, aprovecho para hacer una lista que puede servir de resumen:

¿Qué es la Crisis Salina del Messiniense?
Es una etapa en la evolución del Mar Mediterráneo durante la cual se depositó en su fondo una capa de sal que en algunos lugares supera los 2 kilómetros de espesor. Ocurrió desde hace 5.96 hasta hace 5.33 millones de años, la época en que aparecieron los primeros homínidos en el centro y sur de África, durante la edad geológica del Messiniense. [la versión española del artículo en Wikipedia es algo pobre, pero puede orientar]

¿Por qué se llama así?
El Messiniense es la edad geológica en la que todo esto ocurrió. Su nombre se debe a la ciudad siciliana de Messina, Italia, con importantes yacimientos de sal de esa edad. Lo de 'crisis' viene del cambio tan acusado que se produjo en el tipo de materiales depositados, en el paisaje y en la ecología del Mediterráneo.

¿Cuánta sal hay acumulada en el fondo del Mediterráneo?
En partes del Mediterráneo oriental el grosor de la capa de sal supera los 2 km. Esto se sabe principalmente a partir de la exploración del fondo marino mediante técnicas de prospección sísmica, apoyadas con sondeos de varios kilómetros de profundidad. El volumen total estimado es de más de un millón de kilómetros cúbicos de sal. Esto significa unas 50 veces el volumen que se depositaría si el Mediterráneo se desecara una sola vez. Parte de esta sal ha quedado actualmente expuesta en la superficie continental (como en Messina) gracias a los movimientos tectónicos ocurridos desde aquel periodo.

¿La sal se incrementó o se redujo en esa época?
El volumen de sal en el planeta no cambió, simplemente el océano pasó (a escala global) a ser menos salado, al perder un 10% de la sal que contenía disuelta y depositarla en el fondo del Mediterráneo. Durante esta precipitación de sal, el Mediterráneo devino hipersalino, como el Mar Muerto en la actualidad, y actuó como una gran salina.

¿Se llegó a secar completamente el Mediterráneo?
La mayoría de investigadores piensan que la conexión con el Atlántico se cerró por completo y que del Mediterráneo, al evaporarse, quedaron sólo unos lagos aislados a más de 1 km de profundidad, pero es un tema aún de debate en los congresos (osea, el consenso no es total). La principal evidencia está en las gargantas excavadas por los ríos en los principales deltas durante la crisis. En el delta del Nilo, por ejemplo, esa erosión se propagó río arriba hasta Aswan. Sin embargo, hay sedimentólogos que han documentado peces fósiles de esa edad, algo que sería difícil de entender en unos lagos hipersalinos.

¿Es el único caso en que ha ocurrido algo semejante?
No. Por ejemplo, en el Mar Muerto ocurre algo parecido desde hace unos 150,000 años, en ese caso alimentado por el Mediterráneo. El proceso natural de desecación, que ha sido modulado por la variabilidad climática, está en la actualidad acelerado por el consumo humano del agua.

¿Por qué es importante la Crisis de Salinidad del Messiniense?
Desde el punto de vista científico, porque se trata del cambio medioambiental más extenso y brusco que tenemos bien documentado en la Tierra. Si se confirma la teoría dominante entre especialistas, no sólo este mar se convirtió en un enorme Mar Muerto durante unos cientos de miles de años, sino que seguramente acabó desecándose casi por completo, exponiendo su fondo marino durante un largo periodo comparable de tiempo. Desde el punto de vista socioeconómico, hay que recordar que parte de los recursos de hidrocarburos del Mediterráneo están a menudo bajo esa capa de sal, que dificulta a las compañías las perforaciones debido a sus particulares propiedades mecánicas.

¿Por qué ocurrió este fenómeno?
El levantamiento tectónico de la región de la cordillera Bética (sur de España) y el Rif (norte de Marruecos) cerró progresivamente los canales de entrada (este video puede ayudar a visualizarlo). Hay más detalles en esta entrada. Fue como si hoy se levantara el Estrecho de Gibraltar y redujera la entrada de agua atlántica necesaria para compensar la evaporación en el Mediterráneo (el Mediterráneo descendería 1 metro cada año si no existiera esa corriente). Pero este levantamiento tuvo que competir contra la erosión que producía la propia corriente de agua de entrada, eso es quizá lo más novedoso de nuestro artículo (más información en este post).

¿Y qué implicaciones tiene esta competición?
La competición entre el levantamiento y la erosión del canal de entrada llevó a un equibrio que duró al menos 100.000 años. Si el paso de agua se reducía demasiado, el nivel del Mediterráneo descendía por evaporación, y entonces aumentaba el desnivel a lo largo del canal, aumentando consecuentemente la energía del agua entrante y la erosión que ésta producía. Y viceversa: al aumentar la erosión el tamaño del canal de entrada aumentaba el flujo a través del mismo, llenando de nuevo el Mediterráneo. Ese 'equilibrio dinámico' explicaría porqué la conexión permaneció reducida pero no suprimida durante tanto tiempo y porqué se depósito tanta sal (50 veces lo que se depositaría evaporante el mediterráneo una sola vez).

¿La Crisis Salina del Messiniense dio origen al Mar Mediterráneo?
No, el Mediterráneo ya existía antes y tenía una geografía parecida a la actual (excepto en zonas que han permanecido tectónicamente más activas, como Italia). Por eso se le llama 'crisis', es una etapa intermedia, un paréntesis crítico del Mediterráneo. Pero es breve, menos de 700.000 años, poca cosa en términos geológicos.

Ante el cambio climático, ¿es posible que este proceso vuelva a presentarse?
No en relación con el cambio climático. Nuestra investigación, junto con estudios anteriores, sugiere que los ciclos climáticos no fueron la principal causa de la crisis, aunque sí modularan su evolución. El fenómeno del aislamiento del Mediterráneo podría repetirse dentro de unos millones de años, pero sería de nuevo por causas tectónicas, pues las placas africana y europea se aproximan a unos 4 mm/año y podrían volver a cerrar el estrecho de Gibraltar (a esa velocidad se necesitarían más de 3 millones de años). El problema es que los estudios de la tectónica de la región indican que la aproximación entre ambos continentes (el límite de placas) no ocurre a lo largo del estrecho, sino en otras zonas más al norte y al sur, aún mal determinadas. Por tanto el cierre del estrecho podría no volver a ocurrir nunca.
Si ocurriera, el proceso de desecación sería rápido, el nivel del mar descendería unos 90 cm cada año, que es el exceso de evaporación respecto al aporte de agua de lluvia y de los ríos en el Mediterráneo.
La relación con el cambio climático es más tangencial: si llegamos a conocer mejor cuáles fueron los efectos sobre el clima de la Crisis Salina del Mesinense, entonces podríamos usar este fenómeno tan extremo para calibrar mejor los modelos climáticos computacionales, y usarlos para entender mejor las causas del cambio climático actual.

¿Es cierto que esta crisis terminó cuando el Mediterráneo fue reinundado por aguas Atlánticas?
Es una hipótesis que tiene ya varias décadas de edad. En un estudio anterior encontramos los mecanismos que explicarían una reinundación muy rápida y mostramos también evidencias (imágenes geofísicas del subsuelo) que muestran efectos que pueden ser de aquel evento. Pero ese modelo debe ser aún valorado por el resto de la comunidad geocientífica antes de considerarse válido y probablemente será necesario encontrar más evidencias antes de alcanzar un consenso.

---
Actualización: Dejo un link al artículo de divulgación sobre el mismo tema que he publicado en Amazings.
2012-01-06

Centenario de la teoría de la deriva continental

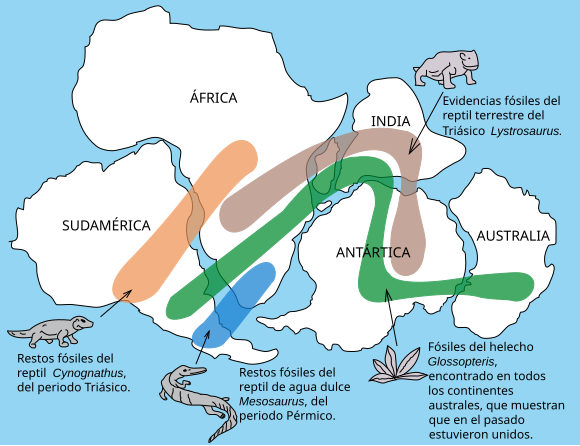
Hoy hace un siglo, el 6 de enero de 1912, Alfred Wegener presentó su teoría de la deriva continental en una conferencia ante la Asociación Geológica en Frankfurt. La idea de que los continentes se desplazan cambiando la configuración de tierras y mares fue polémica desde el principio, pero acabó imponiéndose como el hito clave de la historia de la geociencia, un cambio de paradigma que abrió las puertas a una infinidad de nuevos conceptos: la dinámica terrestre, la evolución del relieve, su relación con la evolución biológica, la edad de la Tierra...
Correlación de antiguas especies animales y vegetales entre continentes actualmente separados.

Wegener no encontró un mecanismo para explicar la deriva de los continentes. Tampoco fue el primero en imaginar la téctónica de placas, pues por ejemplo el geógrafo Abraham Ortelius, nada menos que en 1587, ya había sugerido que Sudamérica y Africa estuvieron unidos en un pasado remoto. Su mérito, como el de muchos científicos de renombre, fue reunir toda la evidencia multidisciplinar posible en su época para sostener de forma convincente su hipótesis. Su teoría a disfrutar del consenso entre geofísicos y geólogos hasta el descubrimiento de las alineaciones topográficas (el trabajo de Marie Tharp en 1957), la concentración de sismos y alineaciones magnéticas (descritos por Vine y Morley en 1963) en el centro del Océano Atlántico. Wegener ya no pudo disfrutarlo. Pero todo encajaba: las alineaciones quedaban grabadas en las dorsales oceánicas durante su expansión, reflejada en la actividad sísmica. El desarrollo de medidas del campo magnético grabado en las rocas ha permitido reconstruir la posición de los continentes a lo largo del tiempo geológico y desarrollar la moderna teoría de la tectónica de placas. Hoy la teoría de la tectónica de placas es aceptada por la inmensa mayoría de la comunidad geocientífica, apoyada por infinidad de otras evidencias, y es la base sobre la que se asienta la mayoría de los estudios de lo que ocurre en la Tierra en escalas de tiempo de millones de años.
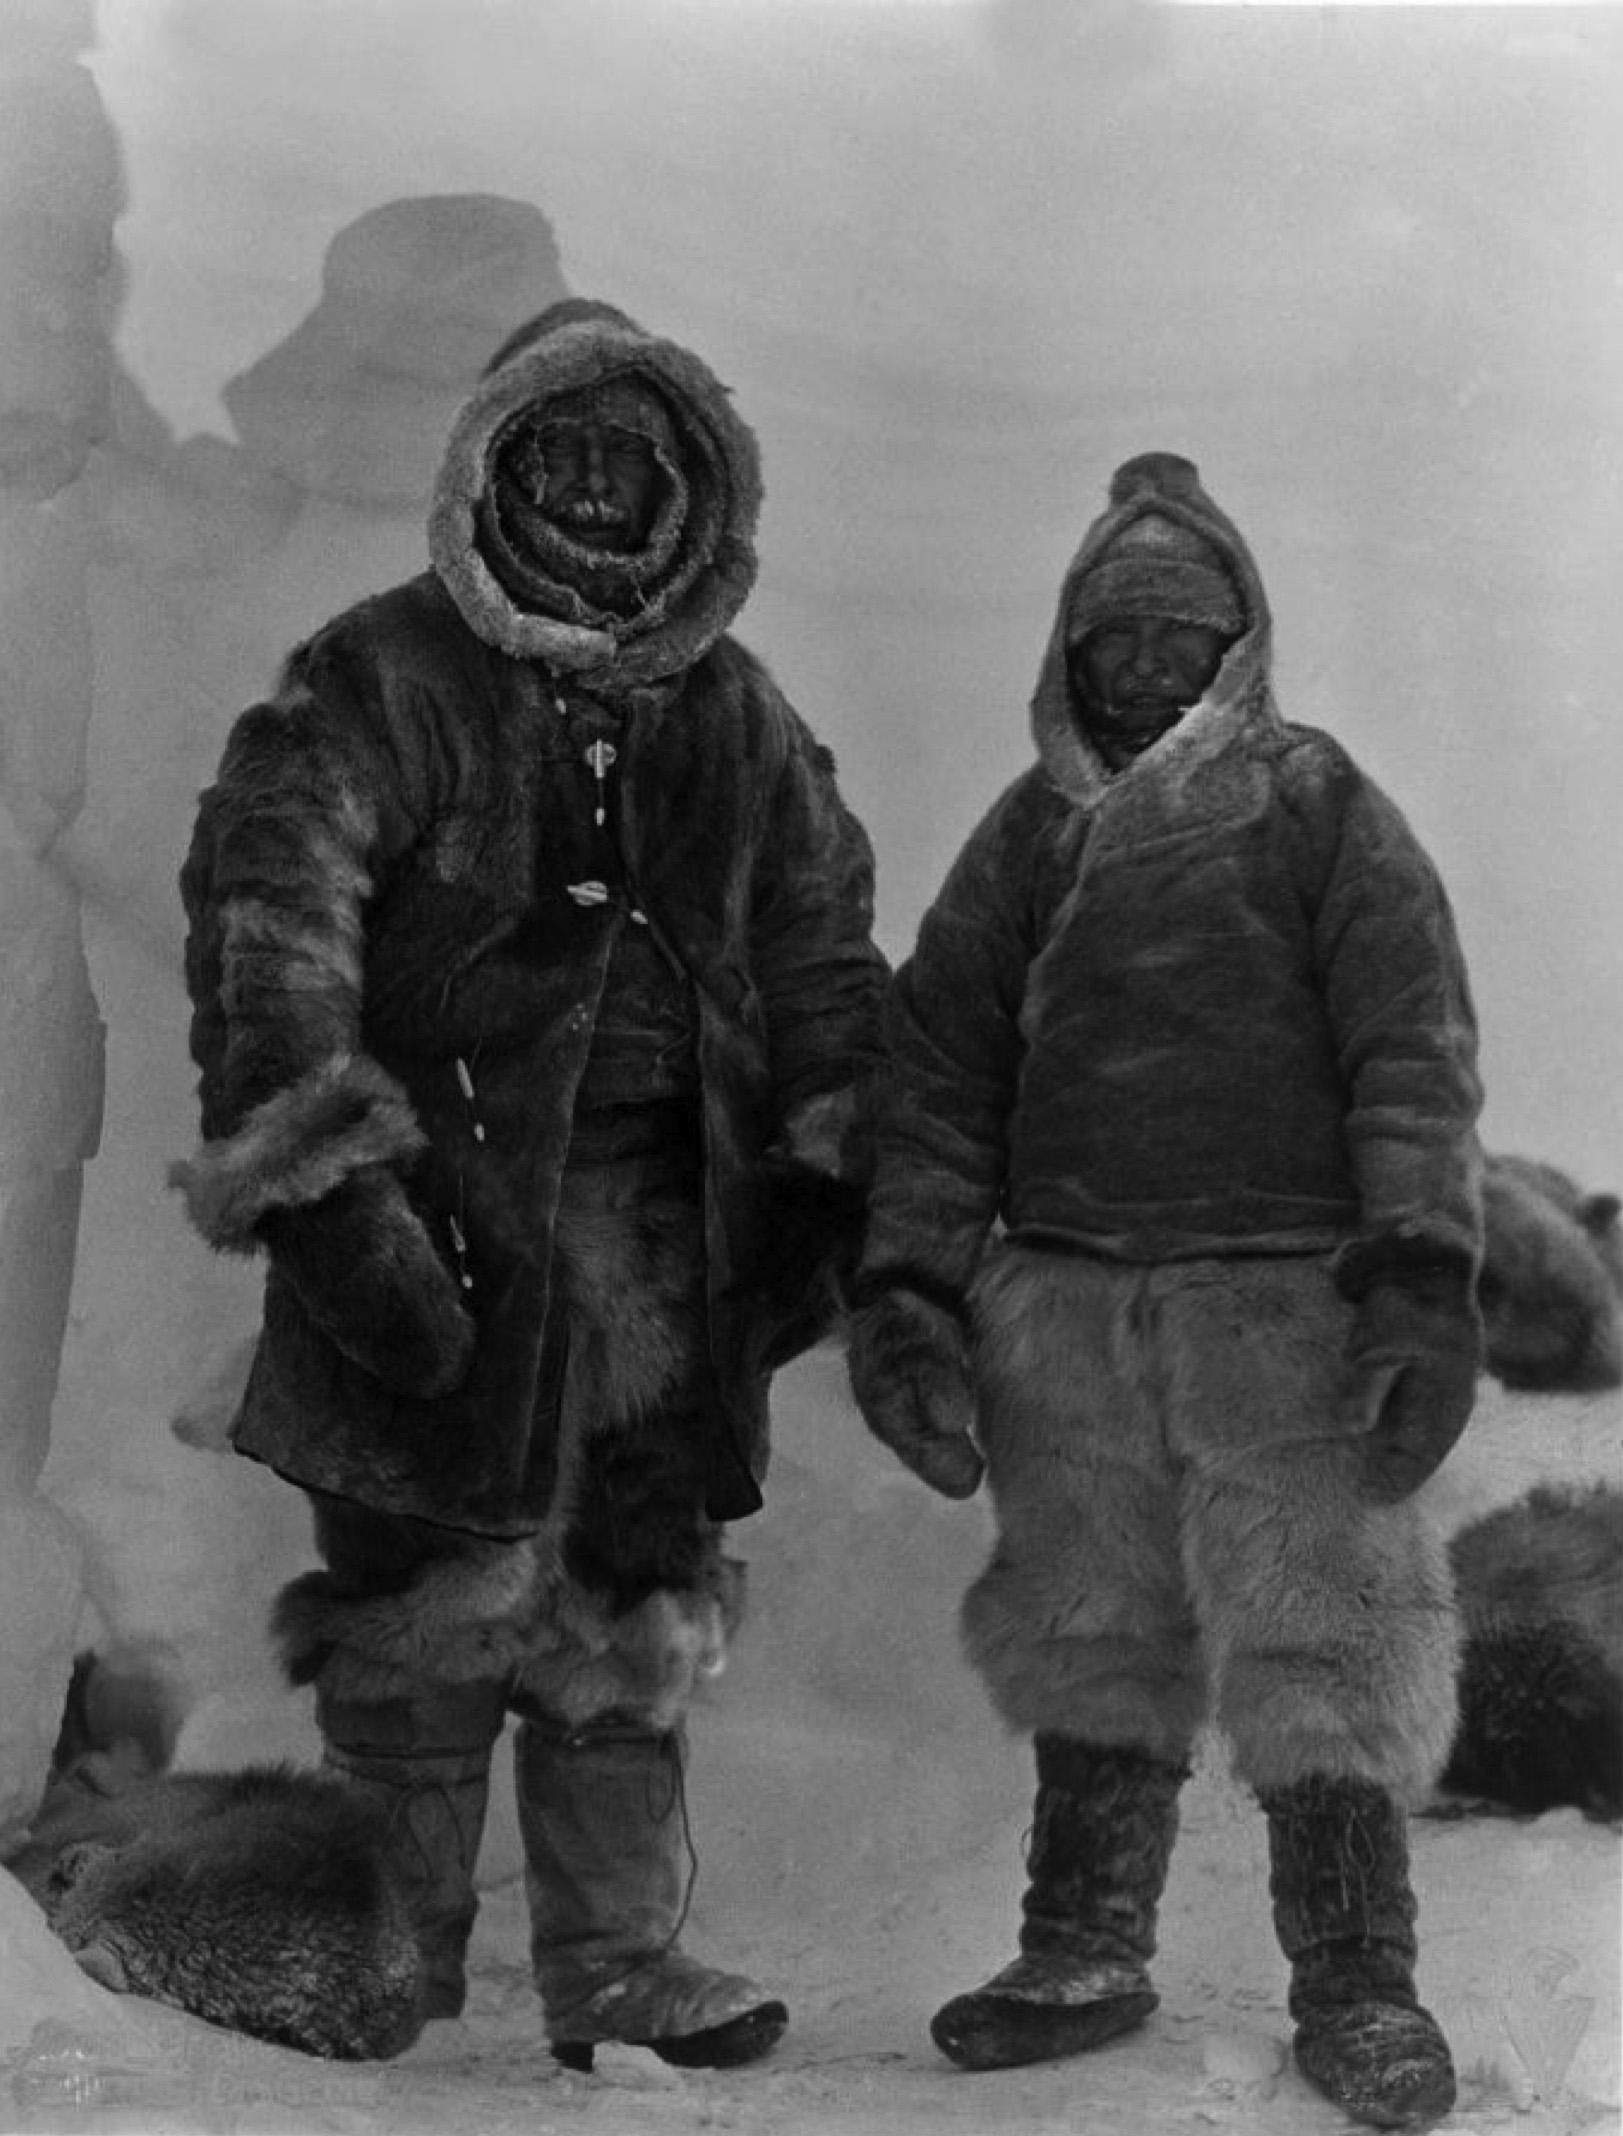
Wegener y el esquimal Rasmus Villumsen 
en una de sus últimas fotografías. 
Groenlandia, 1930.
(Fuente: Alfred Wegener Institute).
Wegener murió durante una expedición en Groenlandia en 1930. Allí continúa todavía su cuerpo, hundiéndose lentamente en el hielo glaciar y fluyendo con él hacia el mar, donde un día flotará en un enorme iceberg a la deriva.


[Hay una entrada sobre Wegener en Amazings sobre el centenario de la deriva continental, por Marcos A. CastroSobre Alfred Wegener en el centenario de la teoría de la deriva continental]